 |
Close
window to return
|
Issue 5, January
2000, pp.2.
Health
and income inequalities into the millennium
Hilary Graham
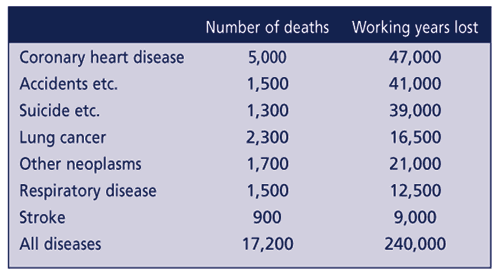
The widening inequalities in health recorded across the 1970s, 1980s and 1990s were the result of widening differentials in major causes of death like coronary heart disease (CHD) and lung cancer. Table 1 plots the scale of health inequalities in the early 1990s for men aged 20 to 64, based on estimates of the number of lives lost and working years lost due to social class inequalities in mortality.(1)
Table 1: Estimates
of the number of deaths and working years lost per year due to social
class inequalities in mortality, selected causes, men aged 20-64, 1991-1993,
England and Wales

Source: Independent
Inquiry into Inequalities in Health(1)
The latest evidence on living standards paints a similarly chilling picture.
The increase in poverty and income inequality, which gathered pace through
the 1980s and early 1990s, is still apparent in the latest data.(2,3)
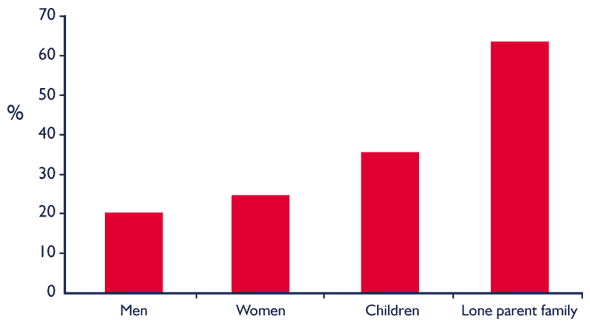
By 1996/7, 25% of the population were poor, living in households with
incomes below half the average income (after housing costs).
Poverty follows the contours of broader social inequalities, with higher
rates among Bangladeshi and Pakistani households and Caribbean households
than among the majority White population (see article by Saffron Karlsen
and James Nazroo, Health Variations Programme Newsletter, Issue 5, pp.8-9).
The burden of poverty also falls disproportionately on children and on
the lone parents (predominately lone mothers) who care for them (Figure
2). At the same time, evidence has been accumulating that exposure to
poverty in the early years of life has a long-term effect on adult health
(see article by Chris Power, Health Variations Programme Newsletter, Issue
5, pp.6-7). While the government's anti-poverty programme is promoting
paid employment as a route out of poverty, the living standards of the
non-working poor remain well below the poverty line.(4)
Figure 1: Proportion in poverty (below 50% of average income after housing
costs) 1996-7

Source: Households Below Average Income 1979-1996/7 (2)
The trends in mortality and in poverty underline the scale of the crusade
needed to reduce health inequalities. Research has an important role to
play in this crusade, by shedding light on how social inequality affects
the quality of our lives and the likelihood of premature death.
Hilary Graham is Director of the ESRC Health Variations Programme and
is based at Lancaster University
References:
1. Independent
Inquiry into Inequalities in Health (1998) Report of the Independent
Inquiry into Inequalities in Health (Acheson report), London : the
Stationery Office.
2. Department of Social Security (1998) Households Below Average Income,
1979 to 1996/7, Leeds : Department of Social Security.
3. Goodman, A. and Webb, S. (1994) For Richer, For Poorer: the Changing
Distribution of Income in the United Kingdom, London : Institute of
Fiscal Studies.
4. Piachaud, D. (1999) 'Progress on poverty' New Economy, 6, 3,
154-60.