AURORA: Autonomous Real-time On-Board Video Data Analytics
What is AURORA?
AURORA aims to develop generic enablers for Low size, Weight, Power, and Cost (SWAPC) intelligence, Surveillance, Target Acquisition, and Reconnaissance (ISTAR) at the enterprise level. It is designed to meet the increasing demand for smart and efficient on-board applications that make use of data streams collected by various sensors, including video camera streams. AURORA is an autonomous real-time and power efficient approach for on-board object detection and tracking on UAVs.
The advantage of using the on-board processing capabilities of the AURORA system is that the amount of data that must be transmitted is significantly reduced, which in turn minimises the delay between the physical detection and tracking of objects of interest.
AURORA Employs cutting edge proprietary IP implemented in a form of smart algorithms. These were developed within the intelligent systems Research Labs, Data Science Group at InfoLab21 with consultancy from EntelSenSys Ltd (www.entelsensys.com).
Main Features
The primary feature of AURORA is the detection of visual novelties using video streams from the small board’s camera mounted on a UAV. The system detects interesting or novel objects that deviate from the background without the need for prior knowledge about the objects to be detected. This enables the system to detect a wide variety of objects including people, vehicles or animals which can then be identified and classified.

The main features of AURORA are:
- Novelty detection using a moving camera
- The transmission of detected novelties to a server application in real-time
- Tracking detected novelties from image to image
- Innovative, proprietary registered IP
- Recursive Density Estimation (RDE). a computationally fast and efficient pixel-wise method of detecting visual novelties, patented.
- Recursive Total Sum distance Density Estimation (RTSDE) - integer only and no division even faster and more robust algorithm developed specially for video analytics.
- ARTOD+ method - very fast method for moving camera
- ELM (Evolving Local Means) clustering for identifying objects as well as grouping features

Detecting Objects (RTSDE)
The recently-proposed Recursive Density Estimation (RDE) technique can be applied to video streams to detect "novelty" pixels that may constitute an object of interest. The technique uses a Cauchy-type kernel, which is a first order approximation of a Gaussian in the Taylor series, to calculate the inverse mean "distance" between an observation, e.g. a pixel's colour, and all past observations for that pixel. This distance is referred to as the "density", with a per-pixel dynamic threshold being calculated at each time step as the mean density minus some multiple (typically 1-3x) of the standard deviation of the density; whenever a pixel's distance drops below this dynamic threshold, it is flagged as a novelty in the current frame and will appear black on a white background.
This is illustrated in the graph below, which was plotted using real data gathered from a video file being processed by RDE. Note the areas where the pixel's density (the solid trace) drops below the dynamic threshold (the dotted trace); the pixel will be flagged as a novelty whenever this happens.


However, this project aims to implement real-time object detection on-board lightweight, low-power hardware, i.e. embedded systems. Many of these systems do not have a hardware floating point unit (FPU), making them very slow when performing calculations that are not integer-only (1, 2, 3, etc). With RDE being heavily based on statistics, it naturally involves divisions and floating point numbers (0.5, 1.8, 2.2, etc), making it very slow when a hardware FPU is not available.
As such, in order to achieve real-time processing speeds on-board these lightweight, low-power embedded systems, a new technique has been developed named Recursive Total Sum Distances Estimation (RTSDE). This technique opts to skip the kernel used by RDE, instead calculating a raw total sum of distances (TSD) between an observation and all past observations; pixels are flagged as novelties whenever the TSD for any pixel colour dimension (e.g. red, green, blue) exceeds a dynamic threshold. Here, the dynamic threshold is calculated as the squared current frame number multiplied by a fixed constant.
This is illustrated in the graph below, which was plotted by processing the same video file as before, but this time using RTSDE instead of RDE. Note that the pixel is flagged as a novelty whenever at least one colour dimension's TSD value (the solid trace) exceeds the dynamic threshold (the dotted trace), whereas for RDE it was when the density dropped below the dynamic threshold. Interestingly, there appears to be more detail in the RTSDE output, which can be attributed to RDE's loss of precision due to using floating point numbers.
 The RTSDE technique uses integer-only arithmetic, with absolutely no divisions or floating point numbers, making it extremely fast, especially when a hardware FPU is not available.
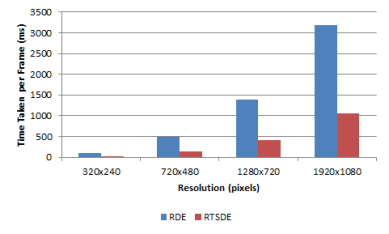
The benchmark timings below were obtained by processing a number of video files with varying resolutions using both RDE and RTSDE on a 2.2 GHz Intel Core i7 3632QM laptop with 8 GB of RAM. As shown, RTSDE is up to two times faster than RDE.

These benchmark timings were obtained by processing the same video files as above, but this time on a BeagleBoard xM embedded ARM development board, which has a 1 GHz ARM Cortex-A8 CPU and 1 GB of RAM. As expected, performance is inferior to the laptop. However, note that RTSDE is up four times faster than RDE!
Videos
DJI S800 EVO Flight Test at Lancaster University
Autonomous real-time on-board video analytics using DJI S800 Hexacopter
Team Members
 |
Prof. Plamen Angelov, PhD tel:+44(0)1524 510391 e-mail: p.sadeghi@lancs.ac.uk website: http://www.lancaster.ac.uk/staff/angelov/ |
 |
Pouria Sadeghi-Tehran, PhD e-mail: p.sadeghi-tehran@lancs.ac.uk website: http://www.lancaster.ac.uk/staff/sadeghit/ |
 |
Christopher Clarke, MSc e-mail: c.clarke@lancaster.ac.uk website: http://www.linkedin.com/Christopher Clarke/ |
 |
Ashley Wilding, BSc e-mail: a.wilding@lancaster.ac.uk |