This page illustrates the online monitoring of gastro-intestinal problems reported as part of the Aegiss project.
The animation may take a minute to load, then you can use the controls at the bottom to play.
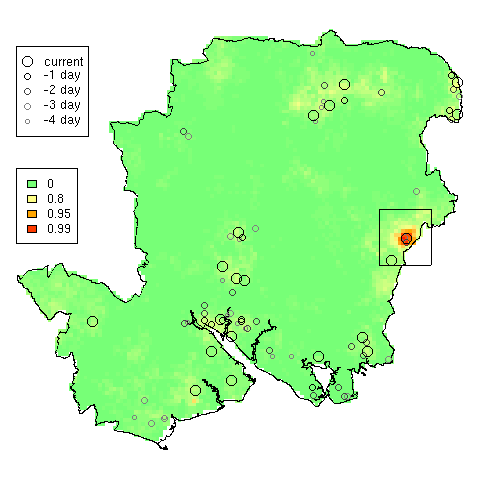
The map shows the border of the study area, the locations of reports of gastro-intestinal problems, and the risk map as a coloured surface. A square box highlights areas where the risk surface exceeds 0.95.
The model for calculating the risk surface for any day uses data for the current data and the previous four days, so we show this by plotting the earlier data with a circle that gets smaller and fades out.