 |
Close
window to return
|
5 March 2001
How much does the public care about health
inequalities?
Peter Smith, Paul Dolan, Rebecca Shaw, Aki Tsuchiya and Alan Williams
Background
- The government's public health agenda has the objective of "improving the health of everyone, especially the worst off" - that is, of improving health and reducing health inequalities. The focus on health inequalities was reiterated in the National Plan, and made concrete by the announcement by the Secretary of State of specific health inequality targets on 28 February 2001.
- Health inequalities have been a major and persistent policy problem in the UK, and many commentators (including ourselves) welcome the current government's clear commitment to their reduction. However, the targeting by the NHS of health inequalities diverts funds from more traditional NHS activity. That is, with a fixed NHS budget, efforts to reduce health inequalities may imply some reduction in the total health improvement achieved by the NHS.
- Ministers must decide what proportion of NHS funds to target at the reduction of health inequalities. To make this decision on an informed basis they require evidence from a range of sources. These can be considered under two broad headings:
- "what works" in the NHS to reduce health inequalities; and
- how strongly the
general public feels about reducing inequalities.
Both types of evidence are in short supply. This note concentrates on the second issue.
Our study
- Our study, Measuring preferences regarding equity and variations in health, is a collaboration between the Universities of York and Sheffield, and is funded by the ESRC Health Variations Programme. It seeks to offer for the first time rigorous evidence on the strength of public feeling relating to health inequalities. It has asked ordinary members of the public how much traditional NHS care they are prepared to sacrifice in order to reduce inequalities. The study comprised three main stages:
- a series of focus groups and in-depth interviews
- structured one-to-one interviews
- a postal survey.
This note describes some of the preliminary findings emerging from the research.
Key findings
Focus Groups and in-depth interviews
- Respondents were presented with information on existing health inequalities, and were asked to comment on their causes and consequences. Overall, the health inequalities information presented was well understood and was familiar to most of the respondents: "you know that people with money live longer and better, don't you". However, all were surprised by the magnitude of the differences between social classes: "I'm surprised that there is such a difference. The difference is startling. It's a terrible thing".
Interviews
- We developed a structured questionnaire, which asked respondents to indicate the extent to which they were prepared to sacrifice some element of health gain for the total population in order to secure a health improvement for a particularly disadvantaged group. The questionnaire was administered through 130 one-to-one interviews with residents from the York area.
- Health inequalities were defined in terms of average life expectancy and rates of limiting long-term illness. Respondents were presented with health differences between:
- the highest and lowest social classes,
- between men and women,
- between smokers and non-smokers,
- between groups defined simply as the 'healthiest 20%' and the 'unhealthiest 20%' of the population.
- We found that many people are keen to reduce health inequalities. Indeed, there is a widespread willingness to redirect considerable resources towards people with adverse health prospects, at the expense of other NHS activity, in line with the government's public health policy.
- There are, however, two details of interest. First, there seems to be considerable variation between individuals in the importance attached to reducing health inequalities (for example, about 40% of respondents favour no targeting of a health inequality based on social class).
- Second, the strength of opinion about reducing inequalities varies considerably depending on the way in which the inequalities are described. For example, people are much keener to reduce life expectancy inequalities defined by social class than they are to reduce identical inequalities defined by smoking status or gender.
- The appendix presents some detailed results. For life expectancy, the central (median) response indicated that an intervention offering 6 months improvement in life expectancy to the lowest social class is regarded as equivalent to an intervention offering 2 years improvement to the highest social class. This is very similar to the response obtained when the sub-groups are defined in terms of the "healthiest" and "unhealthiest" 20% of the population. It indicates considerable willingness to target deprived populations.
- In contrast, when identical life expectancy data are presented but sub-groups are defined by gender, about 60% of respondents favour no targeting of the inequality. We have not yet been able to determine the reason for the increased resistance to tackling the inequality, but it may be due to a belief that - in contrast to the social class inequality - it is effectively unavoidable.
- When the questions were framed in terms of long-term illness, the central response suggested that an 8.5% reduction in the rate of long-term illness for the lowest social class was equivalent to a 2% reduction for the highest social class. A similar response was obtained when the sub-groups used are the healthiest and unhealthiest 20%. When identical data are presented but sub-groups are defined by smoking status, more than 50% of respondents favour no targeting of the inequality. Again, we can only speculate on the reason for the increased resistance to tackling this inequality, but it may be due to a belief that it is to some extent self-inflicted.
Postal Questionnaire
- In the light of these successes, we moved on to develop a postal survey instrument, based on a simplified version of the questionnaire. The dataset of about 850 responses is now ready for analysis. It is expected that preliminary results will be available around Easter 2001.
Policy implications
- Many people are willing to target considerable NHS resources at the reduction of health inequalities. There is therefore already widespread support for current policy.
- Although the existence of health inequalities is widely understood, the magnitude of the inequalities often surprises respondents. Increased provision of information to the public on the nature and magnitude of health inequalities is likely to increase support for health inequality policy still further.
- The variation in public views is nevertheless considerable. For any given health inequality, at least 40% of the population is not persuaded that traditional NHS activity should be sacrificed in order to address the inequality.
- Willingness to tackle a health inequality varies depending on how it is described. For example, a majority of respondents are unwilling to target NHS resources at an inequality defined by smoking status or gender. This suggests that the general public's response to health inequality policy may be highly dependent on how the policy is presented.
The study team:
Paul Dolan, Sheffield
Health Economics Group, University of Sheffield
Rebecca Shaw Centre for Health Economics, University of York
Peter C. Smith, Centre for Health Economics, University of York
Aki Tsuchiya, Sheffield Health Economics Group, University of Sheffield.
Alan Williams, Centre for Health Economics, University of York
Further details:
Peter C. Smith
Centre for Health Economics
University of York
York
YO10 5DD
Telephone: 01904-433779
E-mail: pcs1@york.ac.uk
Further reading:
Dolan, P., Shaw, R., Smith, P., Tsuchiya, A. and Williams, A. (2000),
To maximise health or to reduce inequalities in health? Towards a social
welfare function based on stated preference data, York : Centre for
Health Economics, University of York.
Shaw R., Dolan, P., Tsuchiya, A., Williams, A., Smith, P. and Burrows,
R. (2001), Development of a questionnaire to elicit people's preferences
regarding health inequalities: Occasional Paper, York : Centre for
Health Economics, University of York.
Appendix: detailed
findings
In the questions concerning life expectancy, respondents are asked initially
to choose between programme A, which increases the life expectancy of
both social groups by 2 years, and Programme B, which increases only the
life expectancy of social class V, but does so by 4 years. Those respondents
who choose Programme B are then offered a succession of less attractive
alternatives, in which the benefit to social class V is steadily reduced.
The intention is to identify at which point (if any) the improvement in
health for the disadvantaged group offered by Programme B becomes unacceptable
when viewed alongside the reduction in health suffered by the healthier
group.
Table 1 presents the results for tackling inequalities in average life
expectancy. The first row gives the number of respondents who were not
prepared to sacrifice any total health gain in order to reduce the stated
inequality. For those who were prepared to make such a trade-off, the
following rows then give the point at which felt the benefits to the less
healthy group were not adequate compensation for the denial of benefits
to the healthier group.
Table 1: Average life expectancy questions
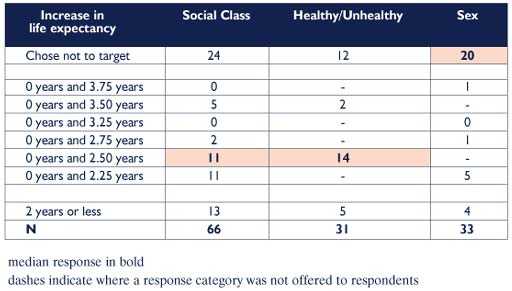
The median respondent
felt that a gain of 6 months to the lowest social class should be regarded
as equivalent to a gain of 2 years to the highest social class. This is
also the median response when the sub-groups are defined in terms of the
healthiest and unhealthiest quintiles of the population. In contrast,
when identical data are presented but sub-groups are defined by sex, the
median preference is to favour no targeting of men at all.
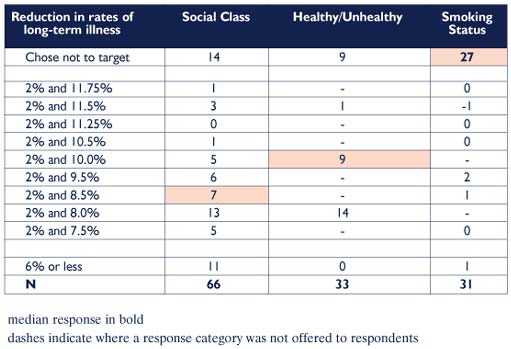
Table 2 shows similar results when the questions were framed in terms
of long-term illness. The median respondent felt that an 8.5% reduction
in the rate of long-term illness for the lowest social class was equivalent
to a 2% reduction for the highest social class. When the sub-groups used
are the healthiest and unhealthiest quintile, the median respondent felt
that a 10% reduction for the unhealthy to be equivalent to a 2% reduction
for the healthy. When identical data are presented but sub-groups are
defined by smoking status, the median preference is to favour no targeting
of smokers at all.
Table 2: Limiting
long-term illness questions