

24% of West Antarctic ice is now unstable

During the past 25 years, ocean melting has caused ice thinning to spread across one quarter of the entire West Antarctic ice sheet, according to a new study.
The research, only made possible over the ‘hostile’ polar regions due to millions of measurements captured by satellite, has painted a new picture of the changes occurring across this remote part of our planet.
By combining 25 years of satellite measurements and a model of the regional climate, researchers from the UK Centre for Polar Observation and Modelling (CPOM) and the new Lancaster University-CEH Centre of Excellence in Environmental Data Science (CEEDS) have tracked changes in the continent’s snow and ice cover.
The study, published today in Geophysical Research Letters, used over 800 million measurements of the Antarctic ice sheet height recorded by the ERS-1, ERS-2, Envisat, and CryoSat-2 satellite altimeter missions between 1992 and 2017 and simulations of snowfall over the same period produced by the RACMO regional climate model.
Together, these measurements allowed the researchers to separate changes due to meteorological events, which affect snow, and those due to longer term changes in climate, which affect ice.
During the last quarter of a century, the ice sheet has thinned by up to 122 metres in places, with the most rapid changes occurring in West Antarctica where ocean melting has triggered glacier imbalance. Glaciers which lose more mass from melting ice than they gain through newly accumulated snow are described as ‘imbalanced’.
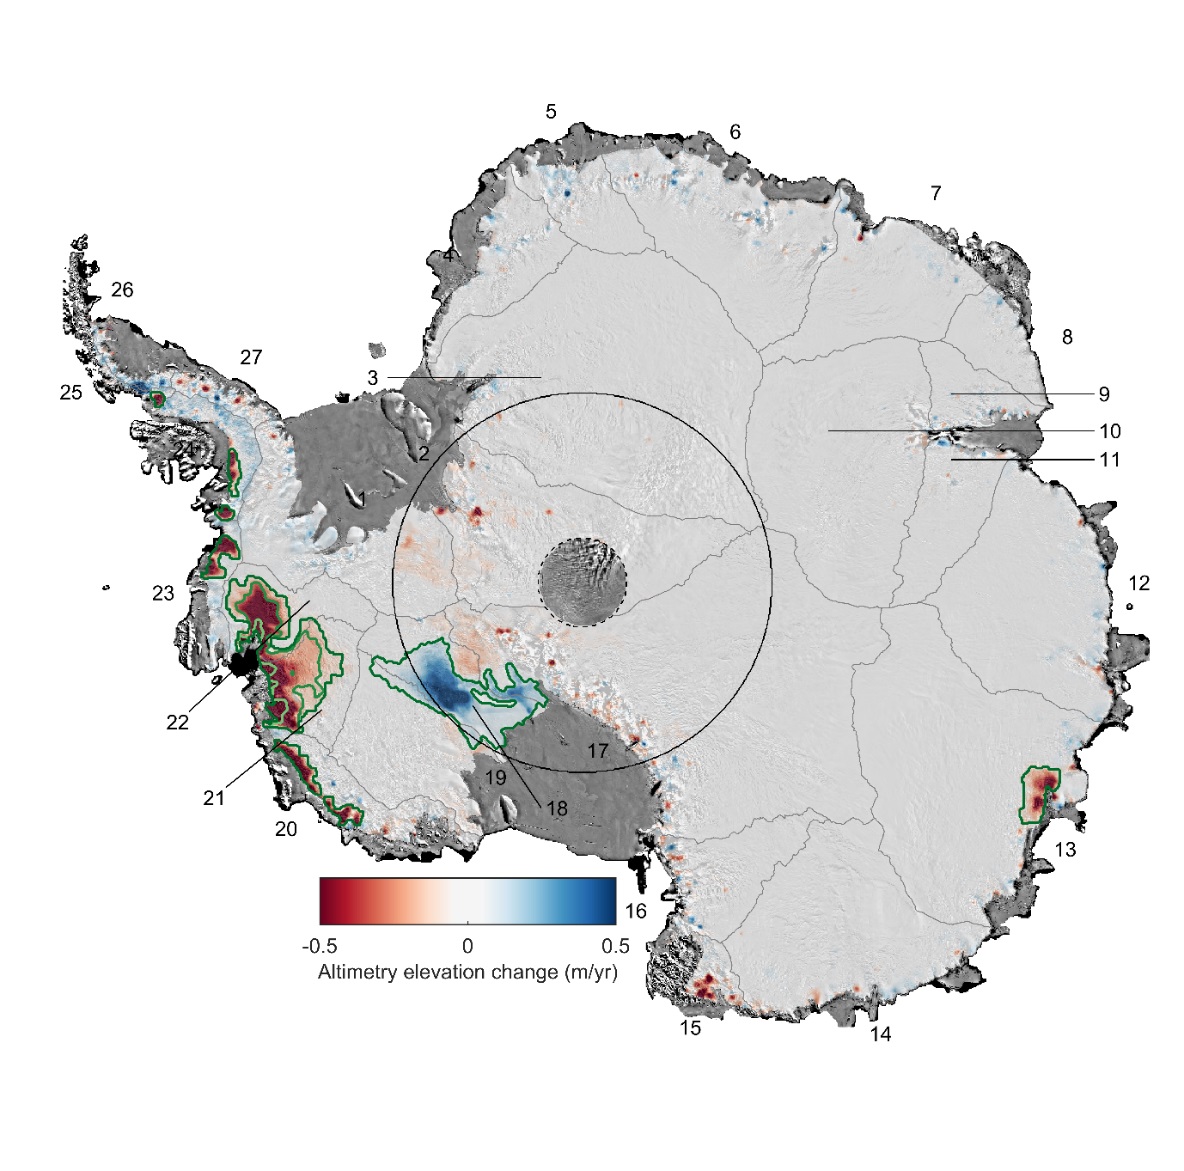
Antarctic ice thickness change between 1992 and 2017.
Lead author and CPOM Director Professor Andy Shepherd said: “In parts of Antarctica the ice sheet has thinned by extraordinary amounts, and so we set out to show how much was due to changes in climate and how much was due to weather patterns.”
To do this, the team compared the measured surface height change to the simulated changes in snowfall, and where the signal was greater they attributed its origin to glacier imbalance.
They found that fluctuations in snowfall tended to drive small changes in height over large areas for a few years at a time, whereas the greatest signals of ice loss were caused by glacier imbalances that had grown progressively larger over several decades.
Co-author of the study, and co-Director of CEEDS , Mal McMillan explained: “This study shows the unique value of long-term, continental-scale satellite monitoring. By tracking the evolution of these glaciers over several decades, and comparing this to the amount of snow that has fallen, we have gained new insight into how changes have spread across this vulnerable region of Antarctica.”
After 25 years, the pattern of glacier thinning has propagated across 24% of West Antarctica, and the Pine Island and Thwaites Glaciers are now losing ice five times faster than they were in the 1990’s.
Altogether, ice losses from East and West Antarctica have contributed 4.6 mm to global sea level rise since 1992.
Dr Marcus Engdahl of the European Space Agency, a co-author of the study, added: “This is a fantastic demonstration of how satellite missions can help us to understand how our planet is changing. The polar regions are hostile locations that are extremely difficult to access from the ground, and the view from space is an essential tool for tracking the effects of climate change.”
The paper Trends in Antarctic Ice Sheet Elevation and Mass is published in Geophysical Research Letters 16 May 2019 DOI: 10.1029/2019GL082182
The ERS-1, ERS-2, ENVISAT and CryoSat-2 satellite radar altimetry time-series produced in this study was funded by the European Space Agency Climate Change Initiative and is freely available at: http://www.cpom.ucl.ac.uk/csopr/icesheets2/
The RACMO regional climate model data used in this study were provided by Michiel van den Broeke and Stefan Ligtenberg of the University of Utrecht
Back to News