Human-Induced Warming (HIW) 2025

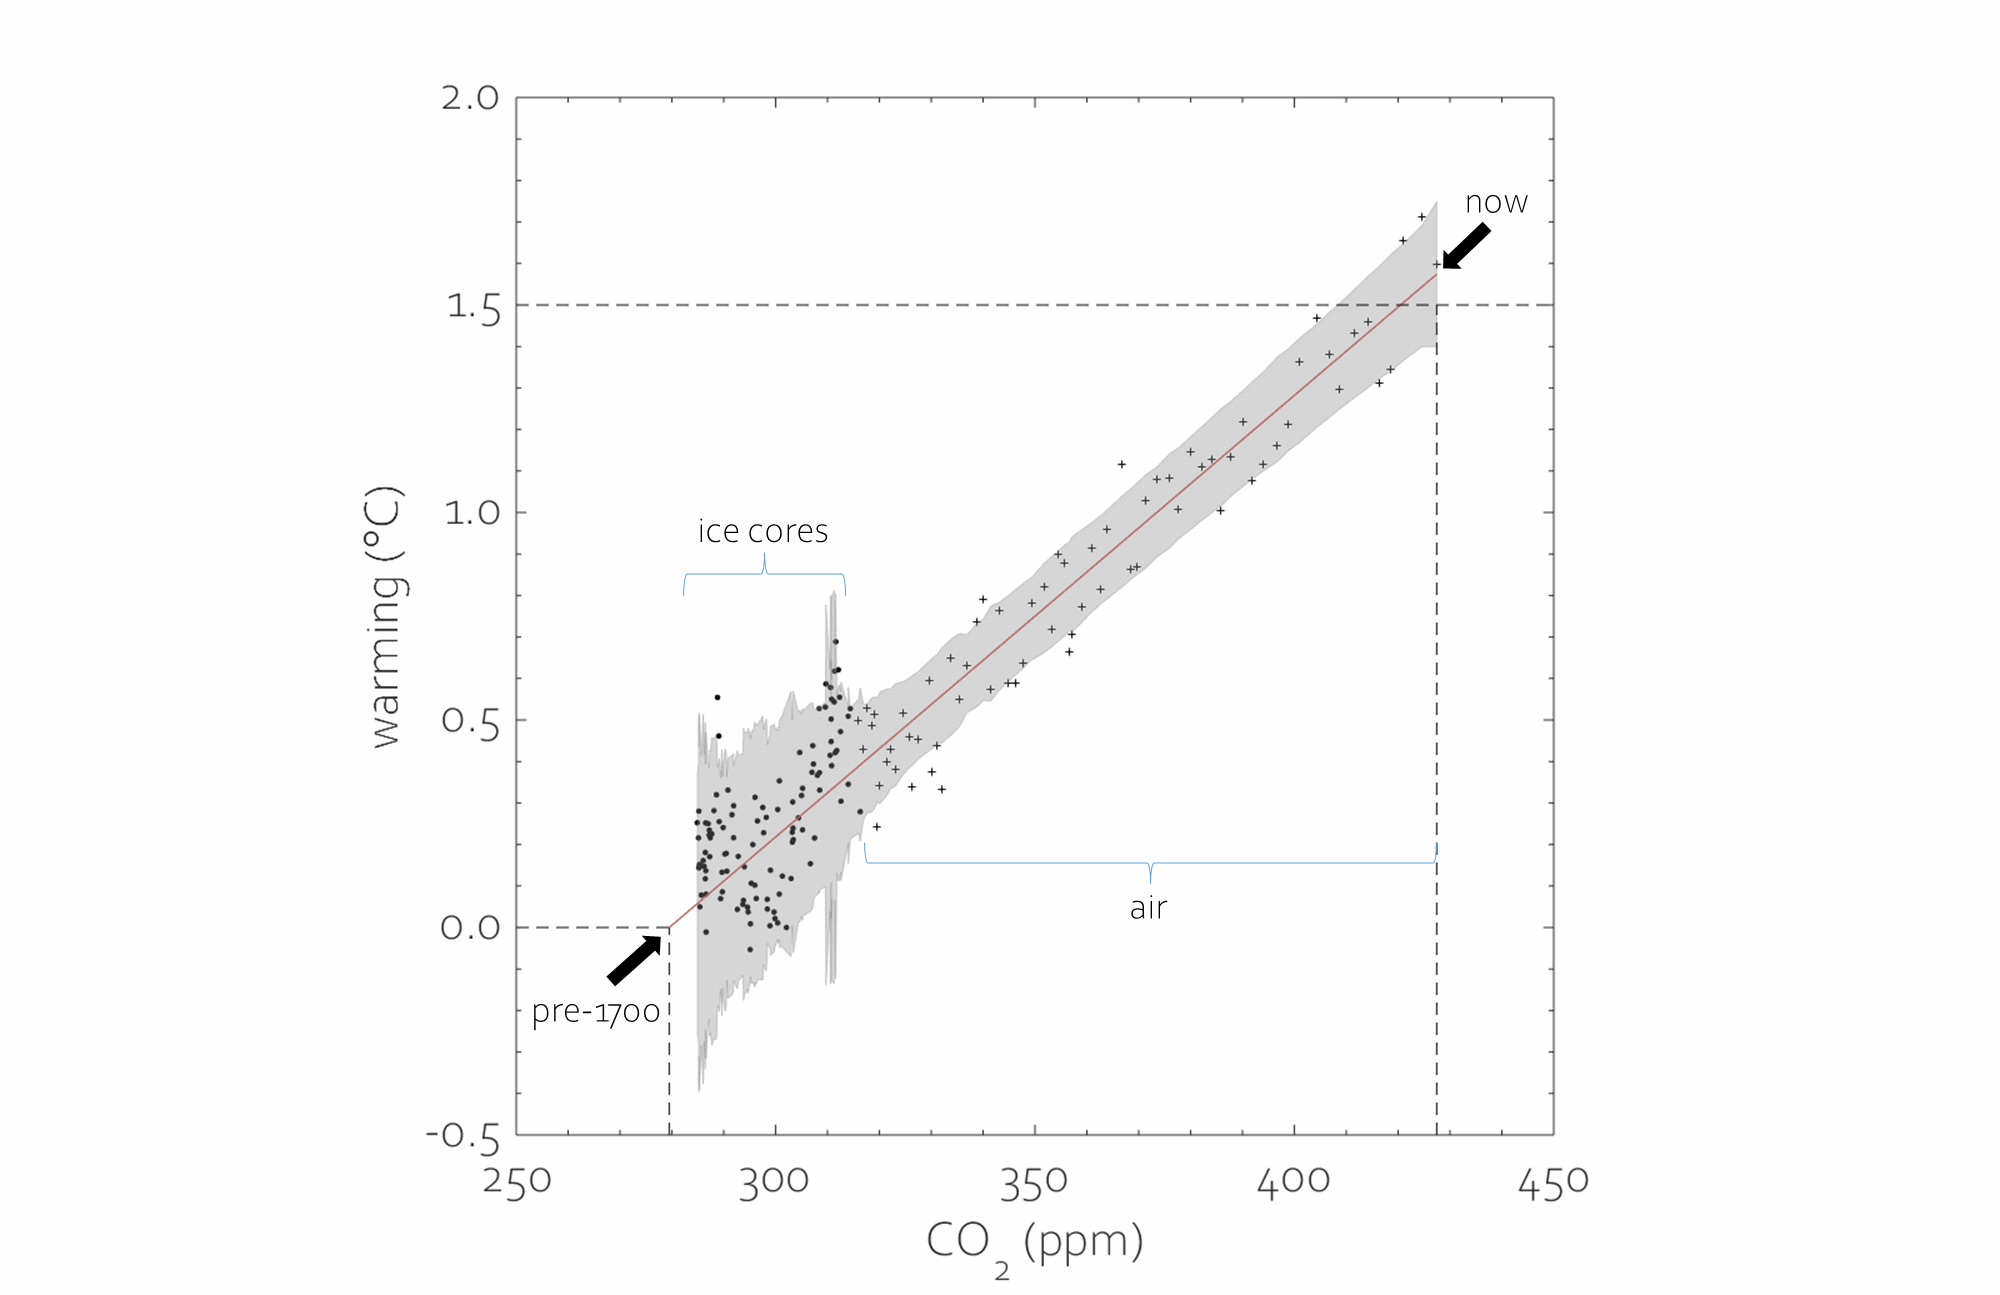
Fig. 1. The relationship between the concentration of CO2 in the atmosphere and increases in global mean temperature. These are annual data from 1850 - 2025 and the data sources and analysis can be found here.
Fig.1 summarises a simple analysis which applies linear regression to global CO2 and temperature data. This regression gives us two things. Firstly, it provides a new and perhaps improved definition of the pre-industrial baseline we measure the global warming against. This is an improvement on the 1850-1900 baseline currently being used because that baseline derives from the most uncertain temperature data and likely has warming baked into it given the Industrial Revolution was well under way even back then. Our pre-industrial baseline is for pre-1700 and derives from a combination of the ice core CO2 data, which stretch back well before the Industrial Revolution, and the regression method we apply. The second thing the regression gives us is an estimate of the size of the warming humans are responsible for, or the 'Human-Induced Warming' (HIW), which is essentially the trendline shown in Fig. 1.
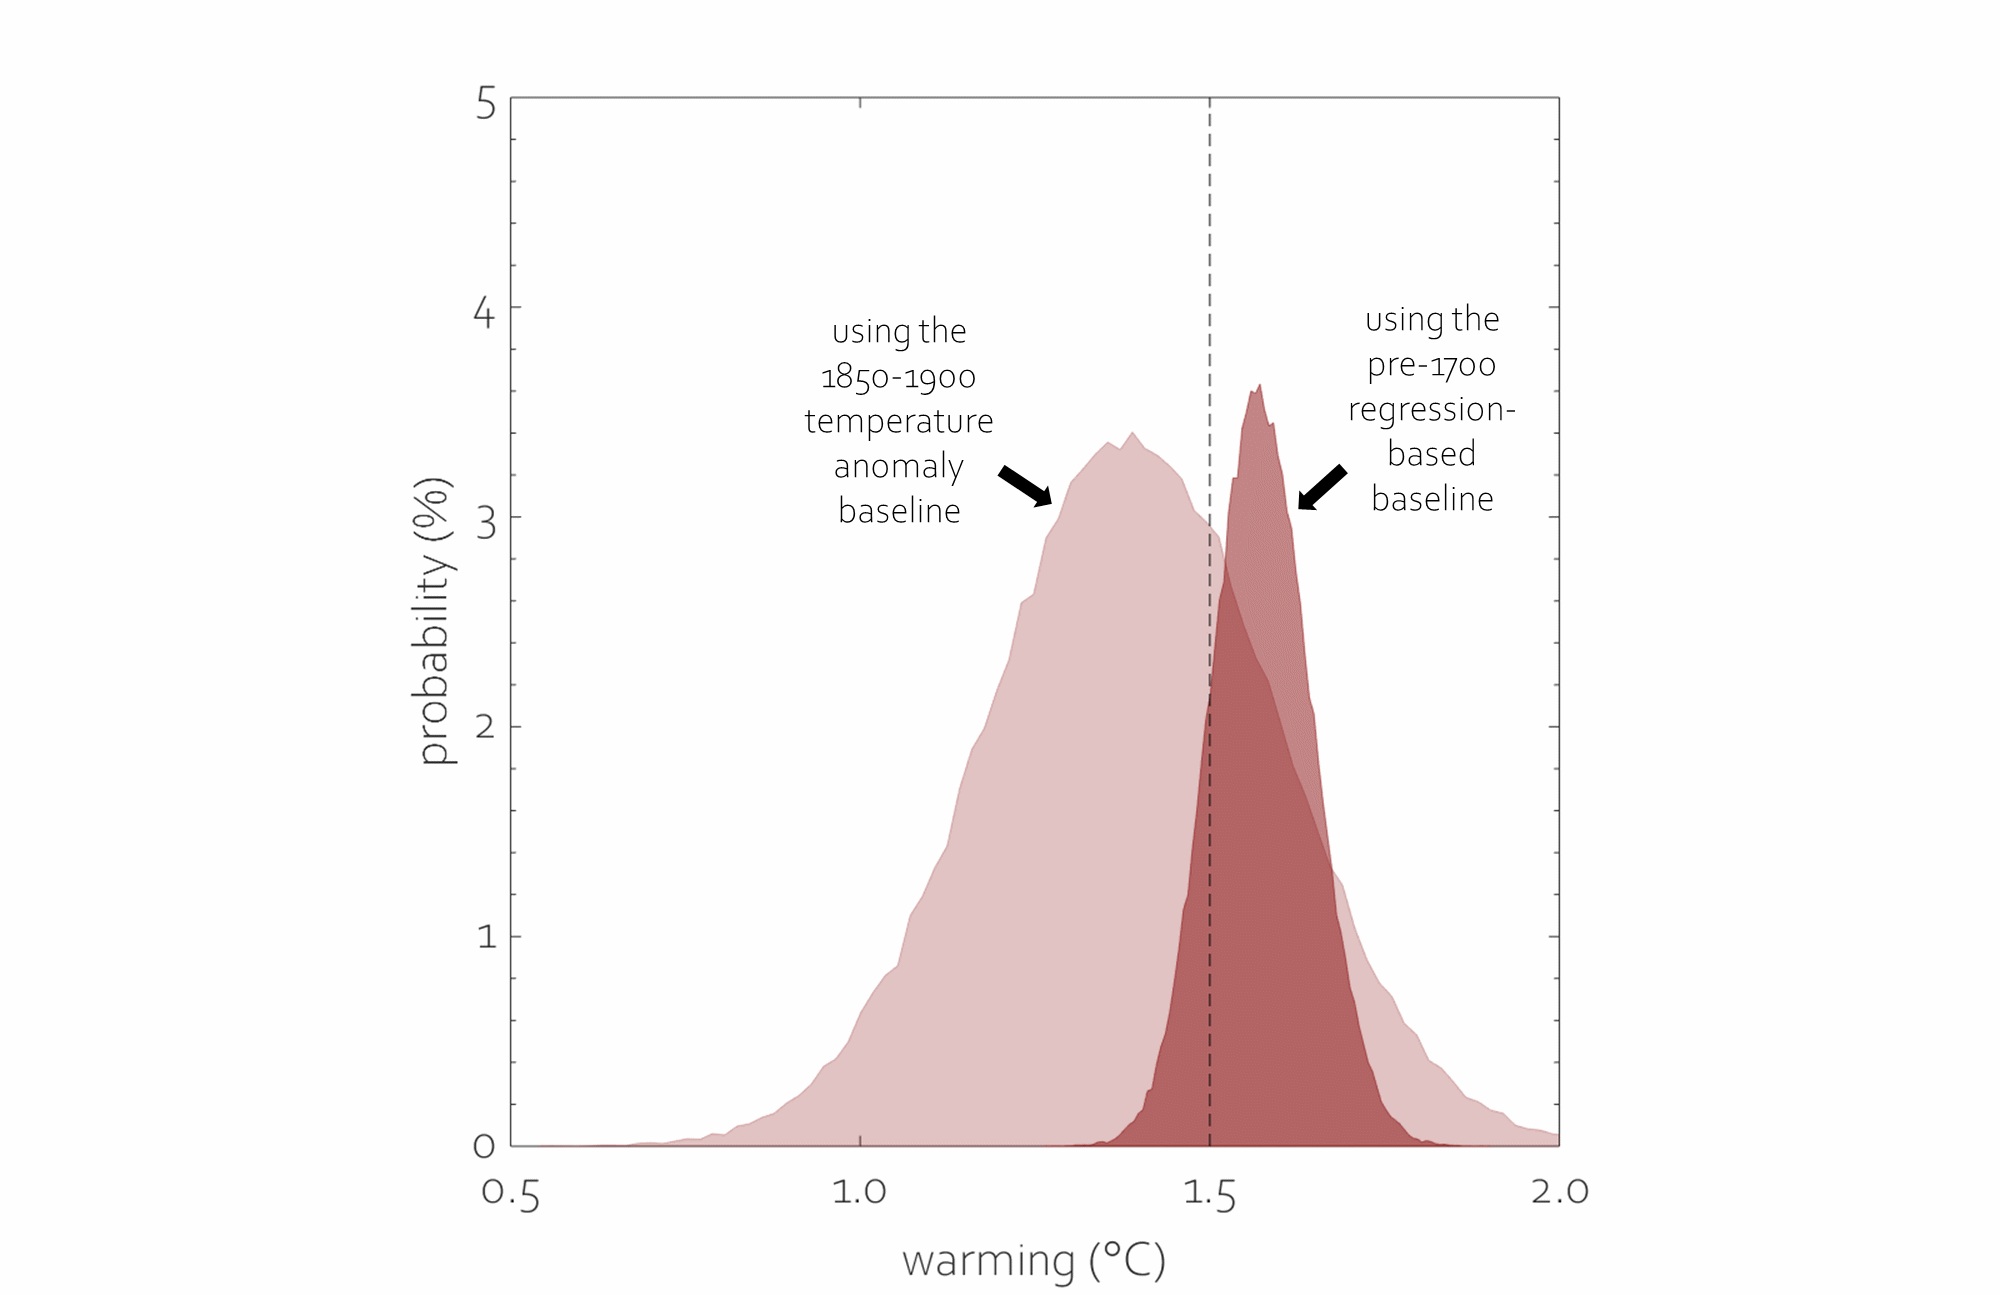
The data we use for the regression shown in Fig. 1 are annual averages of both the global temperature anomaly and atmospheric CO2 concentration, but are updated to September 2025 using the most recent monthly data for 2025. In Fig. 2 I compare the estimate for the 2025 HIW made using the pre-1700 baseline method with that made using the 1850-1900 baseline method. I make it that, using the 1850-1900 baseline, as of September 2025 HIW was 1.39 (1.04 -1.73) °C, suggesting a ~30 % chance the 1.5 °C guardrail has been crossed. Using the pre-1700 baseline, HIW rises to 1.57 (1.46 -1.69) °C with an ~85 % chance the 1.5 °C guardrail has been crossed. Again, the lower HIW estimate using the 1850 - 1900 baseline approach is because there is ~0.2 °C of warming baked into the 1850 - 1900 temperature anomaly data. The difference in the uncertainty between the two approaches is because of the considerable uncertainty baked into the 1850 - 1900 temperature anomaly data (see Fig. 1).

Fig. 2. Estimates of the 2025 HIW as of September 2025

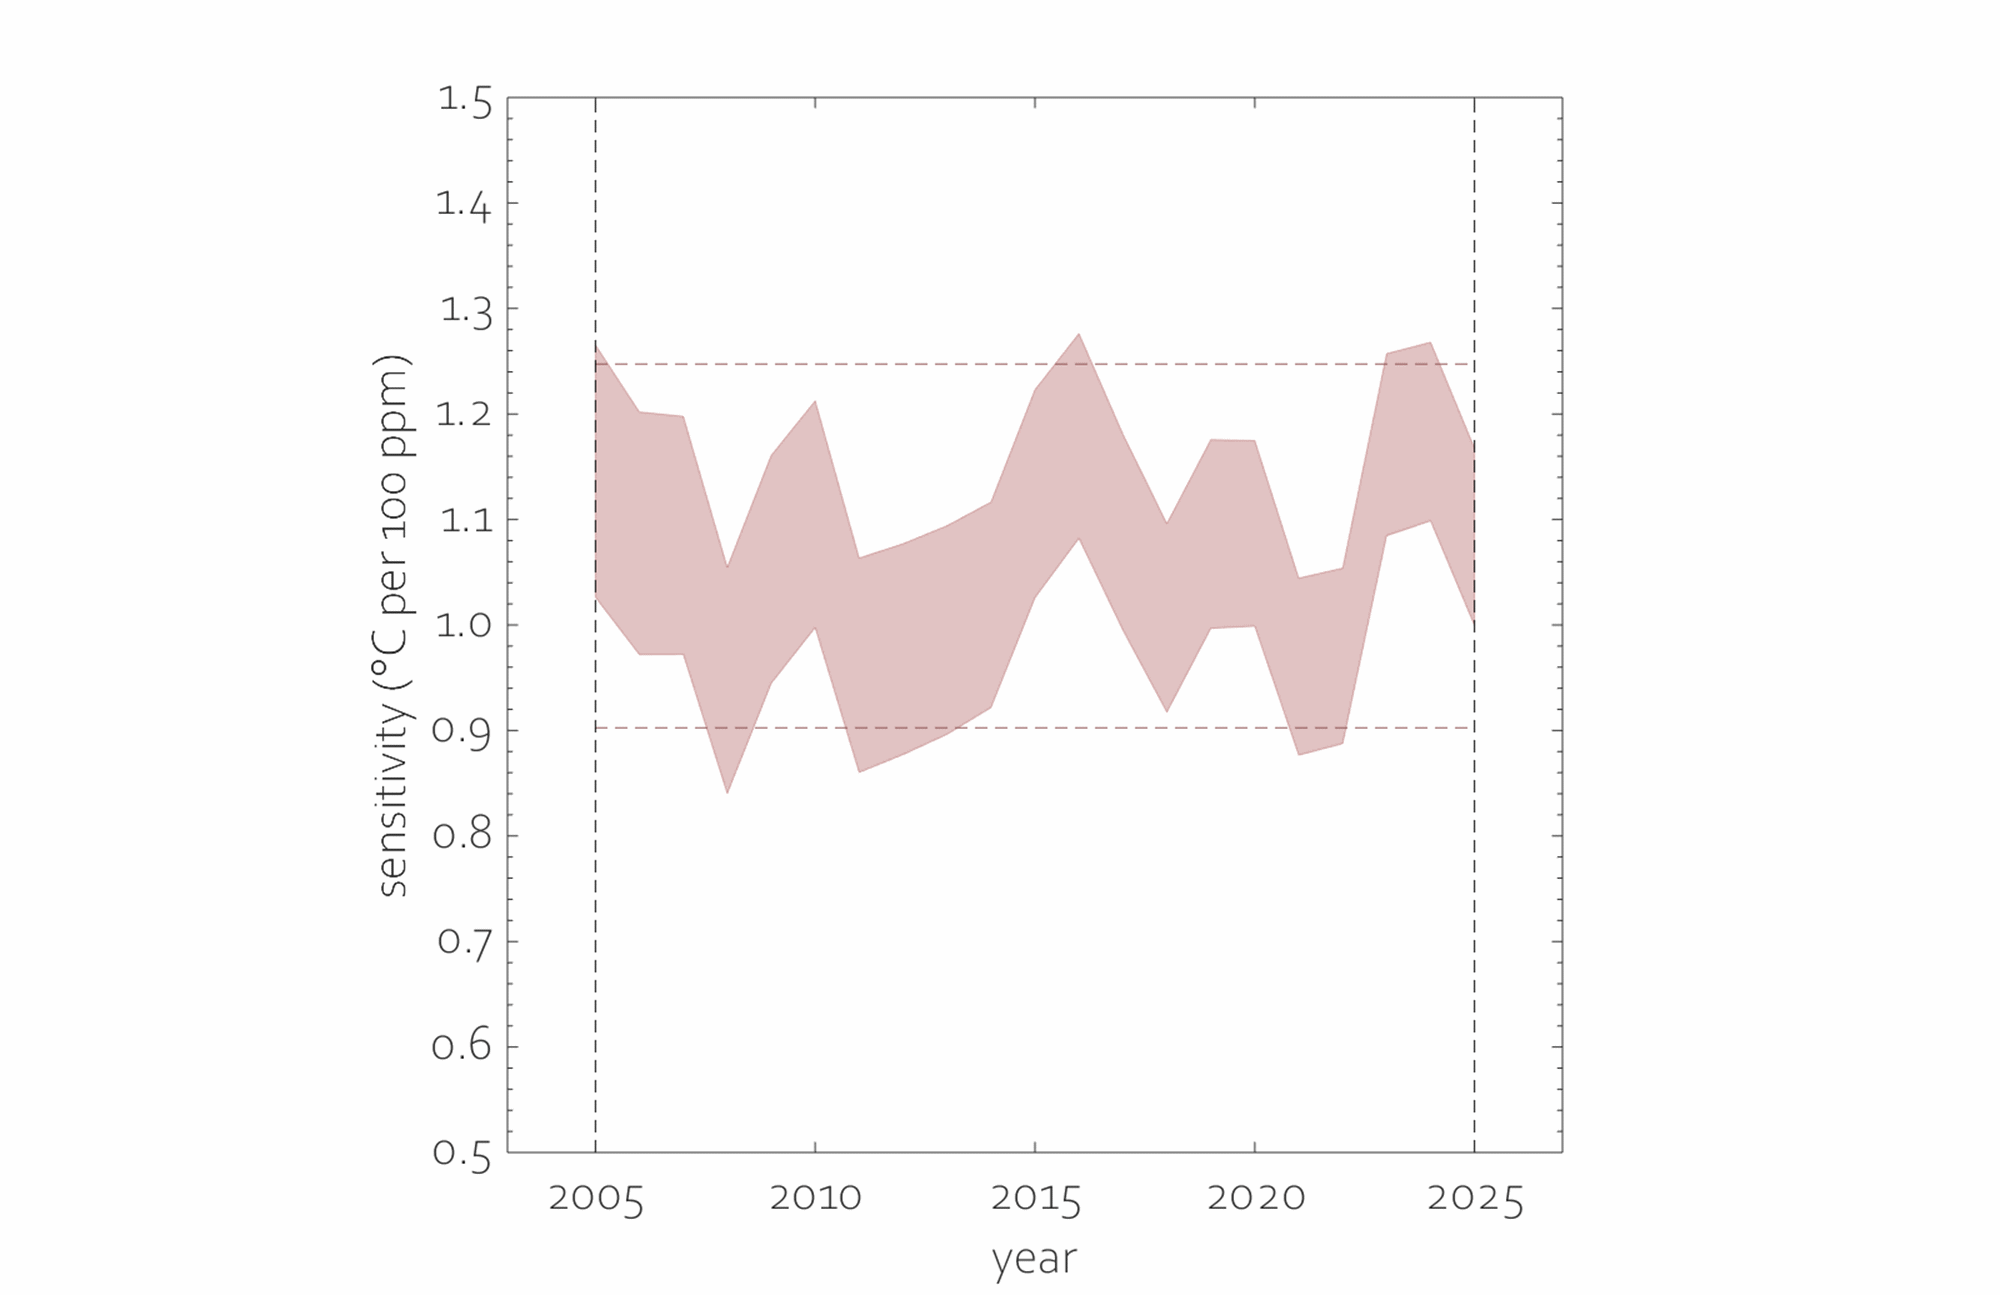
Fig. 3. How the 'observed' CO2-temperature sensitivity has changed in the last 20 years relative to its full regression estimate (dashed lines).
Finally, the slope of the regression line in Fig. 1 is a measure of the climate's sensitivity to increases in atmospheric CO2. Although this appears to have been somewhat constant (hence the straight line), it is really important we test this to remain vigilent over any recent changes in the climate system that could lead runaway warming. Fig. 3 shows a simple such test where I estimate the CO2-temperature sensitivity simply as the ratio of the pre-1700 baselined annual CO2 and temperature change data. Doing this for 2005 to 2025 suggests we are still in a linear regime, for now at least, and the radical warming we saw in response to the 2023/24 El Nino has reverted to trend in 2025 now that event has passed.
Andrew Jarvis, November 2025