
As of the time of writing (14/4/2020) a total of 11,329 people in the UK and 120,863 worldwide are known to have died from the novel Covid-19 virus. This is an unprecedented global pandemic that has reached almost all corners of the globe. This is a new virus having just emerged in Wuhan, China in late 2019, that attacks the lungs causing pneumonia like symptoms. Many epidemiologists are attempting to model the outbreak and the impact of various intervention plans. Every day on Twitter I see new papers and statistics on the pandemic emerge, the aim of this blog post is to summarize some of the papers I’ve read and analyse some of the statistics that have been released.
All statistical models rely on assumptions and because of this they will never be 100% accurate. They make assumptions on how many people will become infected, the number of cases that will require hospitalization and whether this will exceed NHS intensive care capacity. Weiss (2020) suggests the most basic model to use is the SIR model – where the population are split into three subgroups: susceptible people, i.e. those vulnerable to getting the disease; infected people and removed people (those who have recovered and gained immunity or those who have died) – but with an added category for carriers. This extra category is required as a person can carry the disease for up to 14 days without showing any physical symptoms. This means people can pass the disease on to the vulnerable without knowing they were even sick. This is why social distancing measures are deemed so vital in preventing the spread of this virus. In reality much more complex models are required to fully describe the viral outbreak, however, regardless of the complexity it will never fully describe what will happen in real life. Models are used simply as an “informed prediction” based on the data and the population; they are used to make decisions regarding the interventions to be put in place and when they can be lifted.
As this is a new virus, modelling it’s spread is challenging. This is because assumptions need to be made but there is only a small amount of data available. These assumptions are used for key model parameters (Enserink & Kpferschmidt (2020)). One such parameter is the number of new infections caused by one infected person when no intervention measures are put in place, as well as the time frame in which these infections occur. It takes some time and a large quantity of data for these parameters to be accurately estimated.
Coronavirus and the UK: The Numbers
Modelling by epidemiologists in Imperial College London was used to determine the intervention approach the UK government implemented. It was believed that if a hard lock-down was implemented like in China, Italy and Spain then the infection rate would spike once the intervention was lifted (Enserink & Kupferschmidt (2020)). Because of these beliefs, at first less severe social distancing restrictions were implemented to ensure the peak of infections was flattened and the demand for intensive care beds within hospitals did not exceed capacity. However, taking into account new data, a revised model was created and it was decided that more strict lock-down measures were required to save the NHS from being overwhelmed. These new measures were announced on 23rd March 2020. Due to the nature of the disease, it could take up to a month to determine whether these measures are sufficient.
Some of the data used to model the virus outbreak was obtained from the “BBC Pandemic project” (Klepac et. al (2020)) which collected data from over 36,000 UK citizens in order to create age-specific population contact matrices. This data was used to reduce the amount of social contact in order to reduce the spread of the virus. The details of this paper are listed at the bottom of this page and I highly recommend reading it. The study worked through an app downloaded by participants. The app recorded their approximate location hourly for a day, at the end of which the users recorded all social contacts, providing information on each. This study does come with the flaw of self-reporting and the misinformation that comes alongside that, however it does allow for a massive sample size to more accurately portray the UK population.
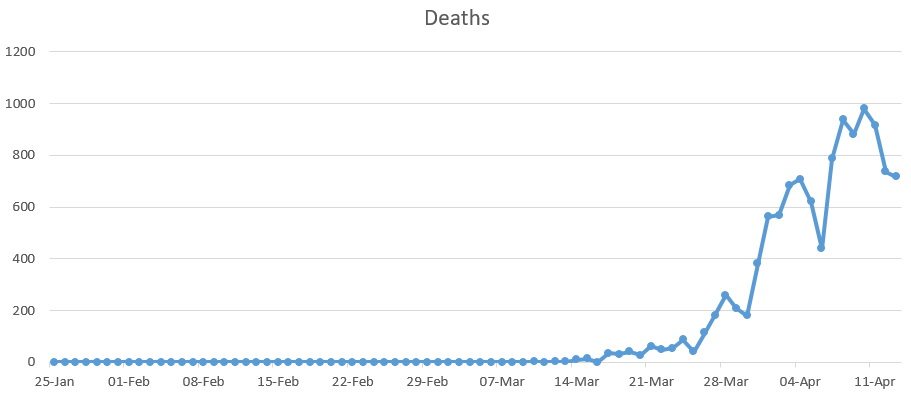
Below are three graphs that depict: 1. The cumulative number of cases, 2. The cumulative number of deaths and 3. The daily number of deaths, all of which relate to the UK only. According to Roser et. al (2020), under current death rates, it would take 7 days for the total number of confirmed deaths to double. This is one of the worst growth rates in the world, only behind that of the US and Belgium (both of which have a 6 day doubling rate). The first two graphs imply exponential growth, however we do expect this to level off and reach some sort of peak in the coming weeks.
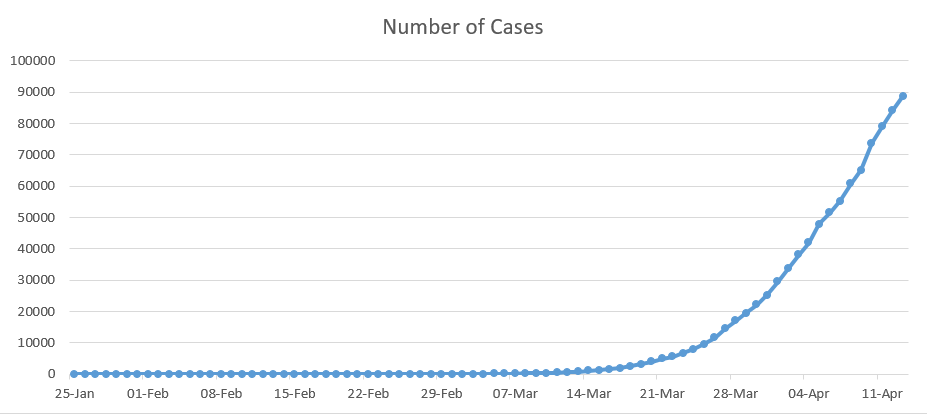
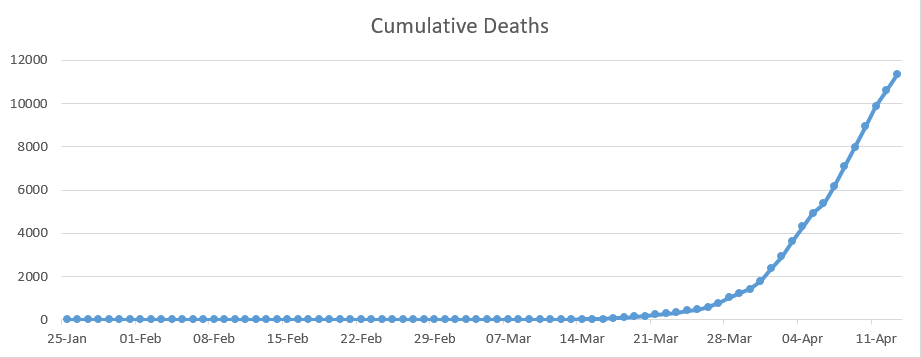
This data has to be taken with a pinch of salt as it may not all be up to date, for example there is a lag between testing and the results being obtained. To add to this, according to Richarson and Spieglhalter (2020) just over 317,000 have been tested in the UK to date, compared to the 1.3 million tests carried out in Germany, this may mean that a greater number of people have had the virus but have not had it confirmed. There are also the aforementioned carriers who will not yet know they were infected as they do not present with symptoms. So is the increase in growth caused by an increases in cases or an increase in testing? The answer to this is likely both.
It is also thought that the number of deaths is much higher than what is being reported. This is because the numbers released only include those who have died in hospital and have tested positive for Coronavirus, there is often a delay of a few days or more for the death to be recorded as being caused by Covid-19.
Singapore Case-Control Study
In this section of the blog, I’m going to summarize one of many studies currently being carried out around the globe into the Coronavirus pandemic. The study I will focus on was conducted by Sun et. al (2020). It investigated risk factors on the virus using a case-control study in Singapore between 26th January and 16th February 2020. 54 cases of Coronavirus were compared to 734 control cases. The data collected included: demographic, co-morbidity factors, exposure risk, symptoms and vitals (including blood pressure, pulse and temperature). Predictors of the virus were split into four categories:
- Exposure Risk
- Demographic Variables
- Clinical Findings
- Clinical Test Results (some patients presented all clinical tests, others just radiological tests)
From this they created four prediction models, whose variables were selected using stepwise AIC to create logistic regression models:
- Model 1: all covariates from all 4 categories,
- Model 2: demographic variables, clinical findings and all clinical test results,
- Model 3: demographic variables, clinical findings and clinical test results excluding radiology,
- Model 4: only demographic variables and clinical findings.
From this study, they found that positive cases of Covid-19 were more likely to be older compared to the controls (with a p-value less than 0.0001) but they were not more likely to have any of the co-morbidity factors than any of the controls (this is an unusual finding as the UK government listed a set of conditions such as diabetes, asthma and heart disease make a person more vulnerable to the disease; I would have thought this would have shown up in the co-morbidity results). However, the exposure factor was deemed significant with 59.3% of cases having had contact with someone with the virus or having recently traveled to Wuhan, compared to only 17.2% of the controls. Cases were also deemed more likely to have a fever (p-value of 0.003) and signs of pneumonia through radiology results (present in 42.6% of cases compared to 11.1% of controls).
From Model 1 it was deemed that exposure risk was most significant in resulting in a positive Covid-19 result. In the other 3 models, which exclude exposure, a high temperature is deemed the most relevant clinical finding in predicting a positive result apart from in Model 2 where Gastrointestinal symptoms were deemed marginally more significant.
It was concluded that Model 1, which takes into account all risk factors, performs exceptionally well in predicting a positive Coronavirus status but even with an absence of exposure status the models 2 and 3 performed sufficiently. The evidence did however show a reduce in performance in using model 4, where basic clinical tests such as bloods were not used. For more information on this study I would recommend reading the paper by Sun et. al (2020) listed in the references below.
Concluding Remarks
Although modelling is very useful in analyzing the spread of Coronavirus and decision making for intervention practices, there is a lot that these models will not show us such as: the degree to which the public comply to social distancing intervention measures, the introduction of a vaccine as well as the toss-up between saving the economy and reducing the death rate. As all models will contain some degree of uncertainty, they must be analysed for pitfalls and decisions should not be based solely on their findings.
References & Further Reading
- Klepac, P., Kucharski, A., et al. (2020). Contacts in context: large-scale setting-specific social mixing matrices from the BBC Pandemic project. medRxiv
- Enserink, M., Kuperschmidt, K., (2020). With COVID-19, modelling takes on life and death importance. Science (New York, N.Y.) 367(6485)
- Richardson, S., Spiegelhalter, D., (2020). Coronavirus statistics: what can we trust and what should we ignore? The Observer https://www.theguardian.com/world/2020/apr/12/coronavirus-statistics-what-can-we-trust-and-what-should-we-ignore
- Roser, M., Ritchie, H., Ortiz-Ospina, E., (2020). Coronavirus Disease (COVID-2019) – Statistics and Research, Our World In Data https://ourworldindata.org/coronavirus
- Sun, Y., Vanessa, K., et. al (2020). Epidemiological and Clinical Predictors of COVID-19, Clinical infectious diseases: an official publication of the Infectious Disease Society of America
- Weiss, S. (2020). Why modelling can’t tell us when the UK’s lockdown will end, Wired https://www.wired.co.uk/article/coronavirus-modelling-uk-lockdown