Having done my MSci in Financial Mathematics, I was eager to spend some of my MRes year researching finance-related topics. I got this opportunity with my second research project, which was on robust portfolio optimisation.
Robustness in portfolio selection is not a novel concept, having been reviewed extensively in financial literature. It aims to address the downfalls of traditional portfolios by enforcing a lower bound on the losses that can be incurred under a range of market scenarios. The objective of the project was to assess whether classical frameworks for portfolio optimisation such as Markowitz and CVaR can be improved by adding a robust element.
Robust and non-robust versions of the CVaR and Markowitz models were created. They were each firstly trained on historical returns data for 55 stocks from between 1995 and 2025, and their split assessed using three criterion – their stock allocation, their division between industries, and their geographical spread. These are shown in the diagrams below:
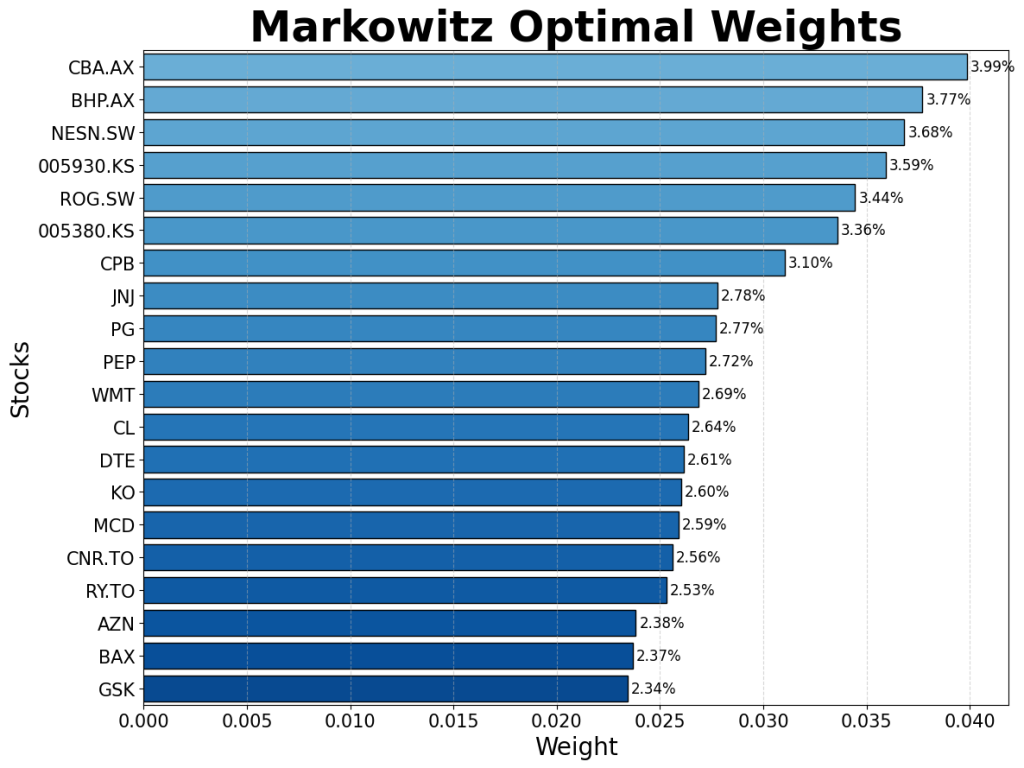
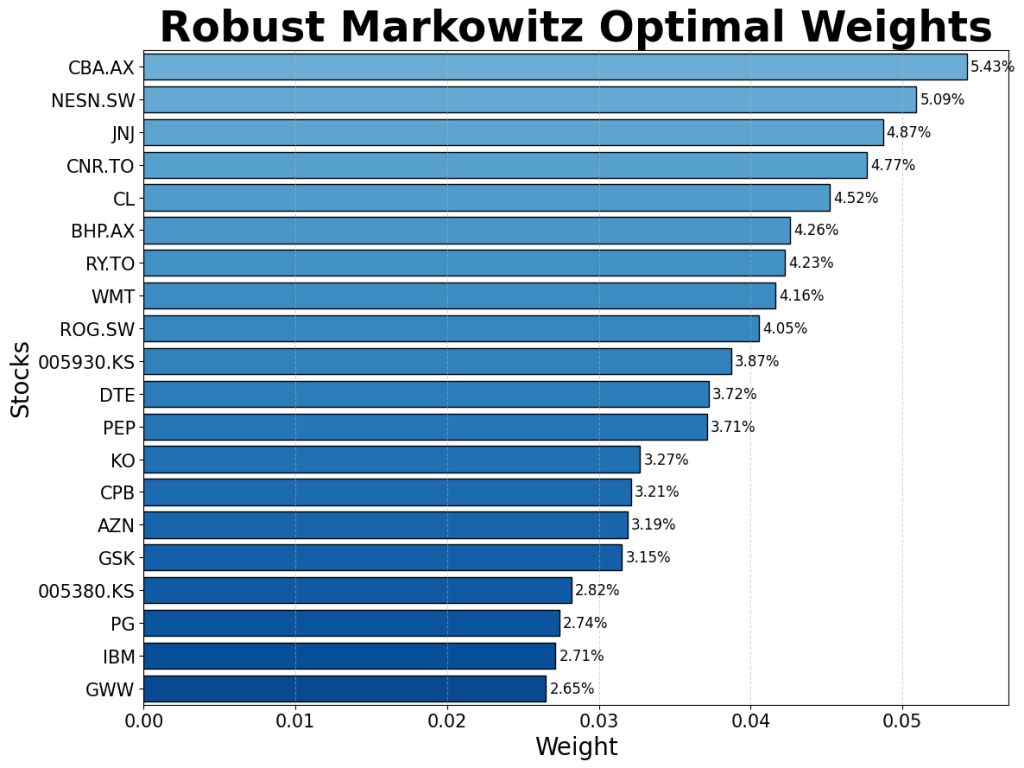
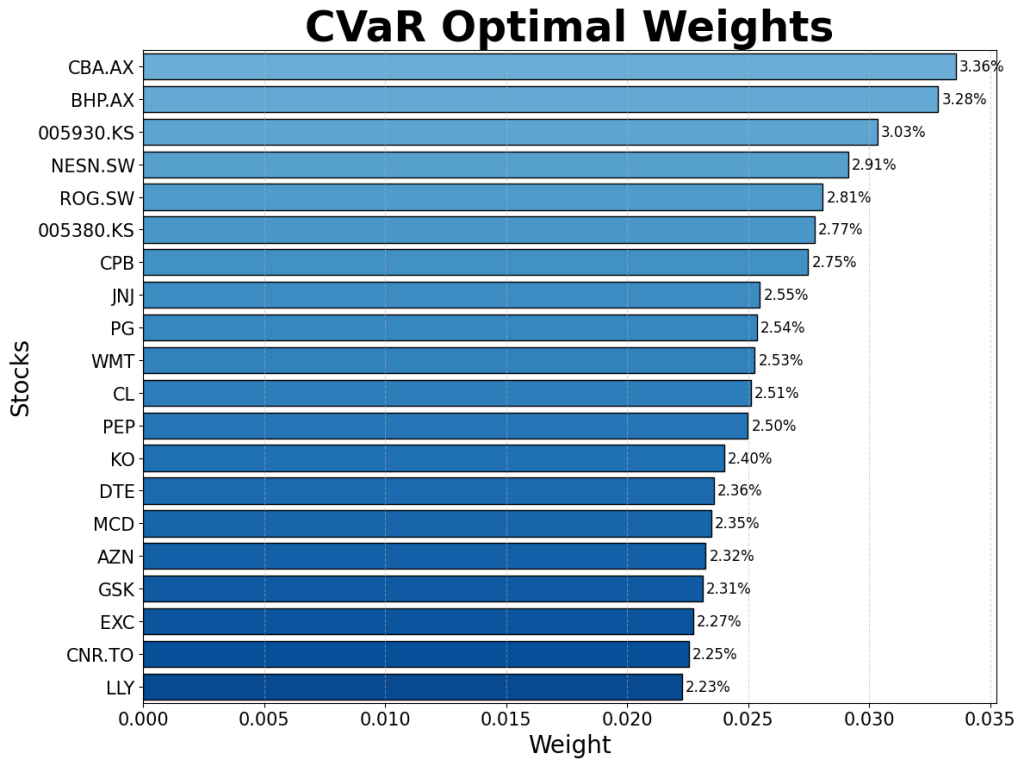
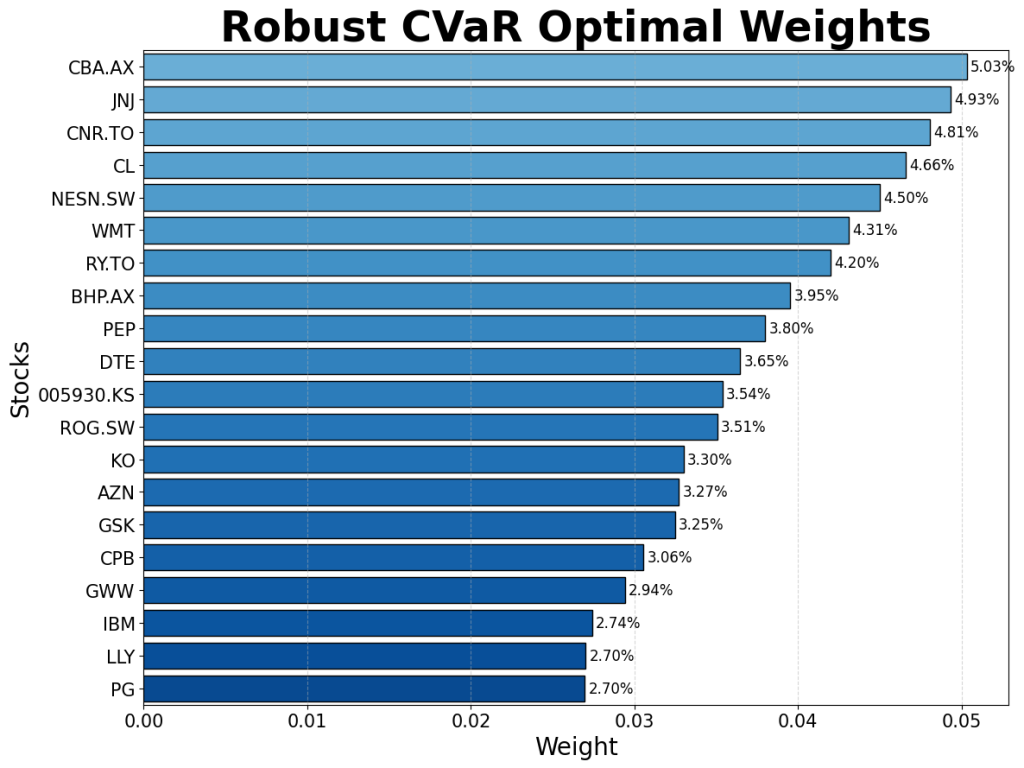
Contrary to expectation, the robust models focus a larger proportion of capital into a smaller number of “safe-haven” assets. These tend to be well-established companies in traditionally safe sectors, with a focus on steady returns rather than outsized and volatile growth. Some of the companies to consistently receive a large proportion of capital include Johnson & Johnson (JNJ), The Commonwealth Bank of Australia (CBA.AX), and Nestle (NESN.SW).
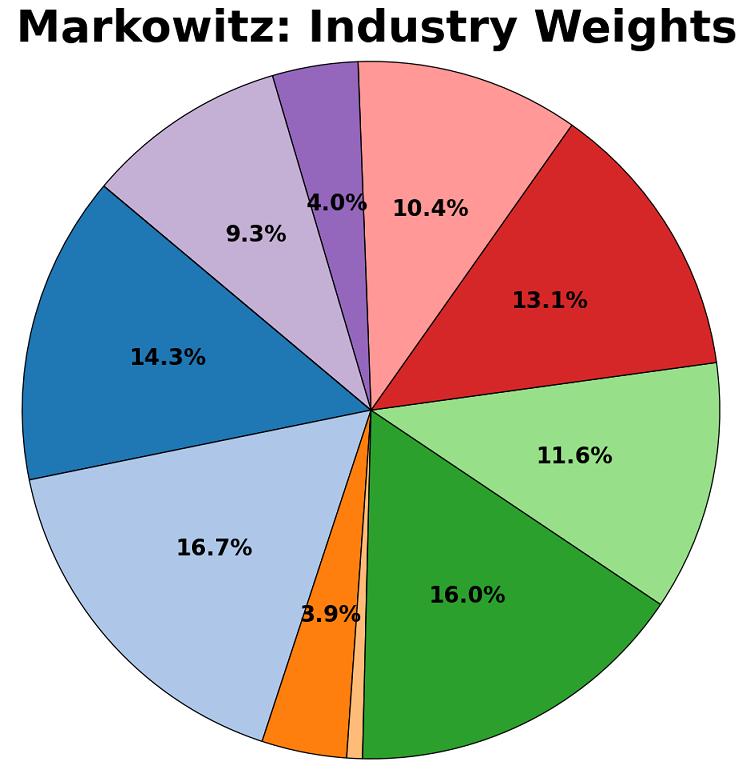
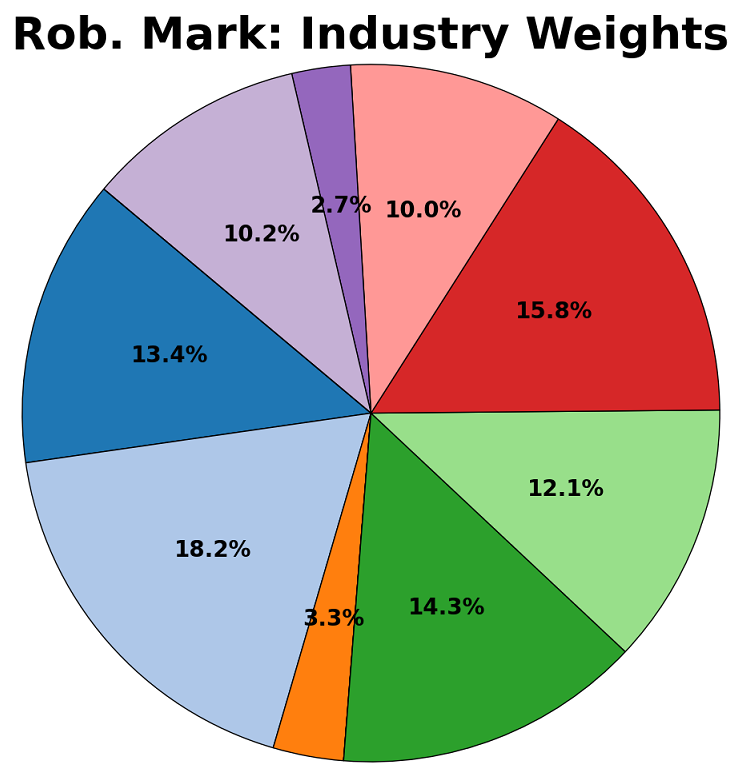
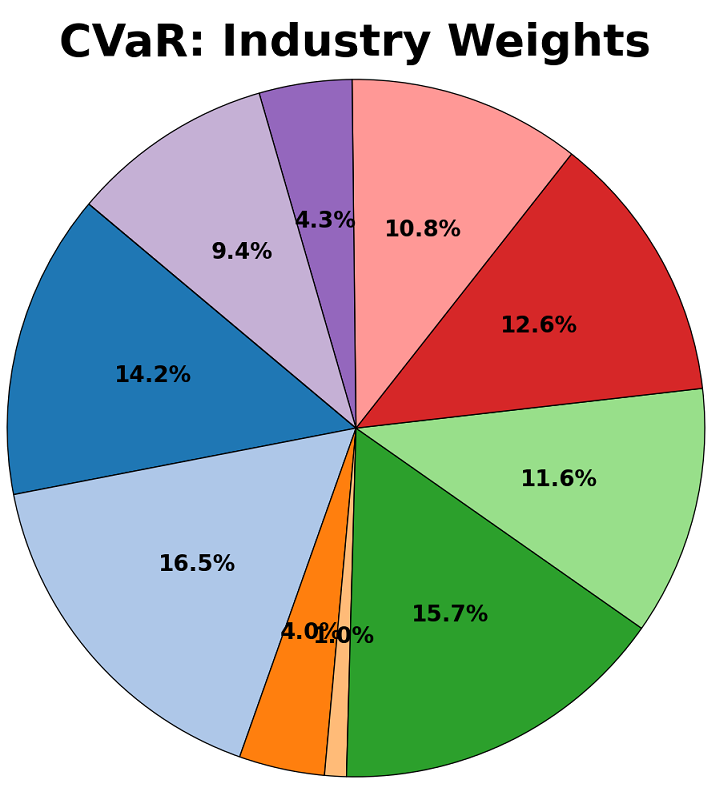
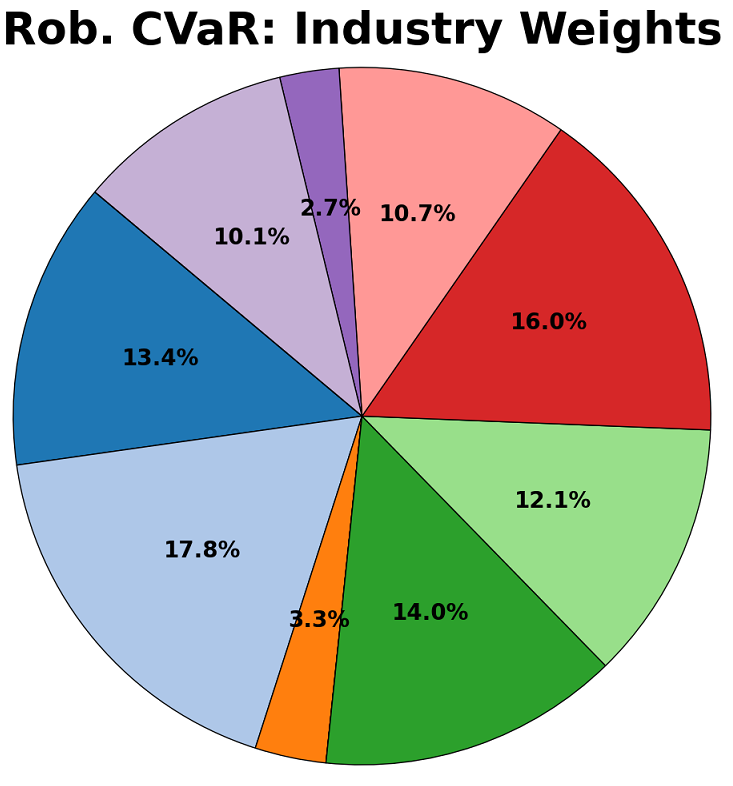
The robust models show an expected exodus from risky sectors such as consumer discretionary, and an inflow into the sectors of healthcare and consumer staples which empirically weather financial shocks well.
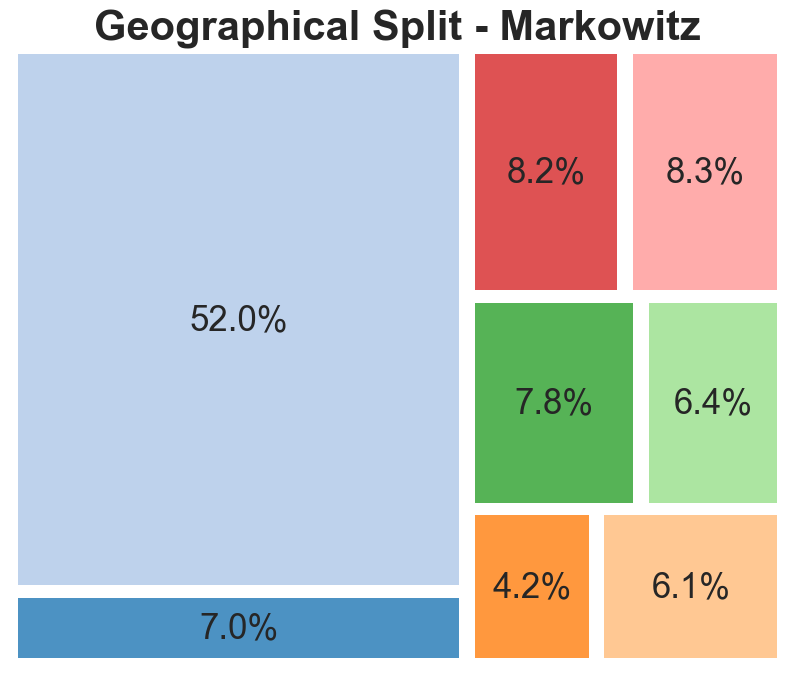
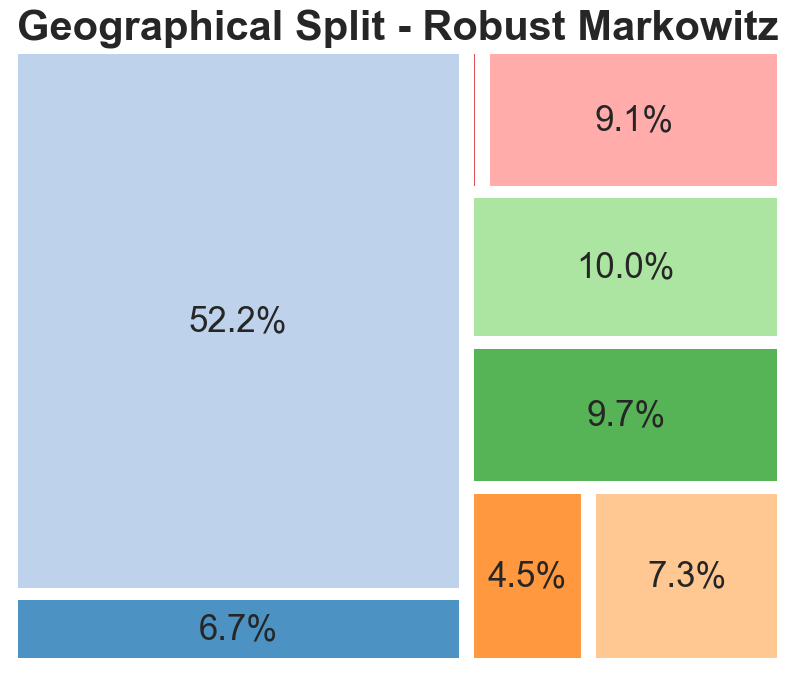
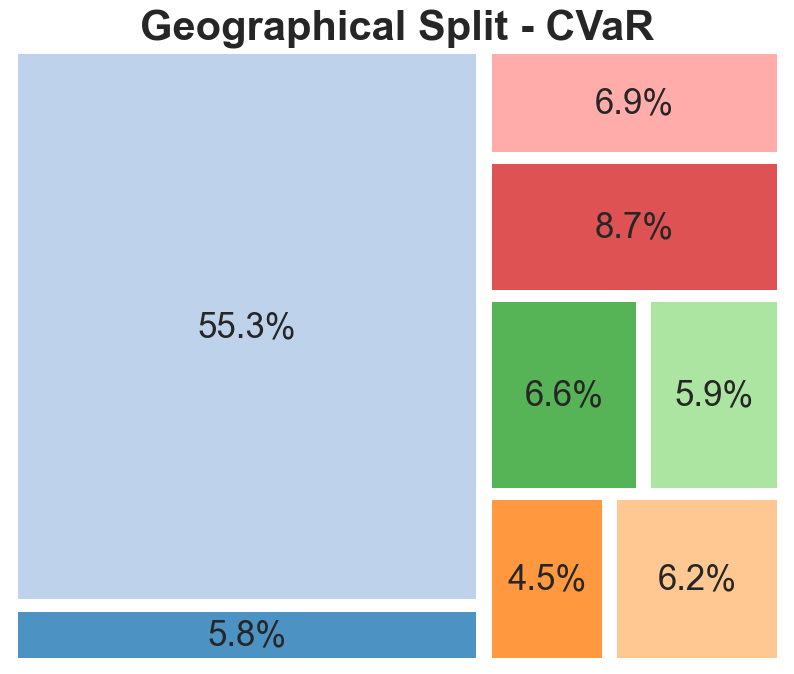
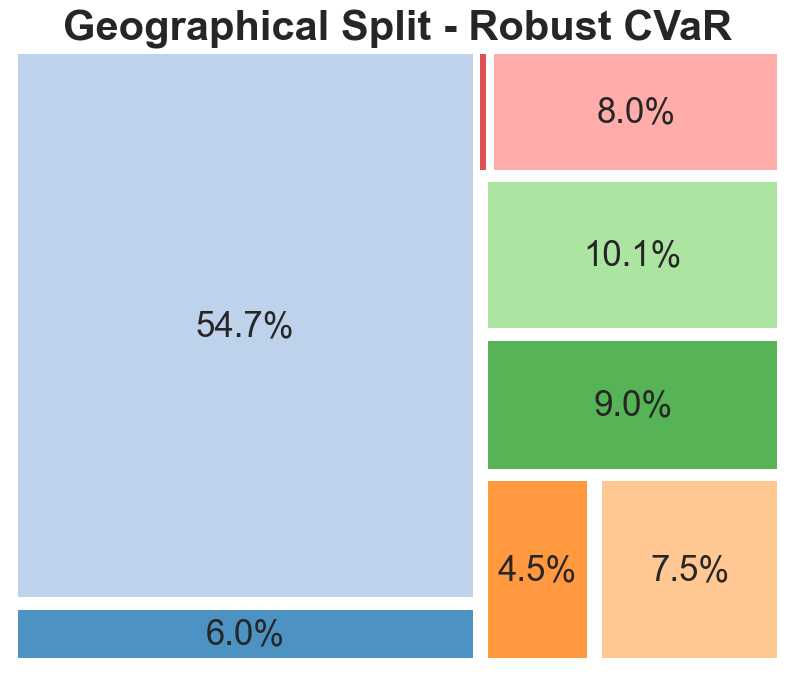
The geographical split indicates that portfolios are dominated by American listed companies, representative of the large share of the global stock market which the US represents. The main change that the robust models exhibited is a movement from EU-based companies to Australian and Canadian entities. Although this could be indicative of factors such as a lower correlation between the latter and American stocks, it is likely this is random and based more on the specific chosen companies.
Having assessed the allocations, we next wanted to assess how well the portfolios performed. We did this firstly using an in- and out-of-sample method on the thirty years of financial data. This yielded the following graphs:
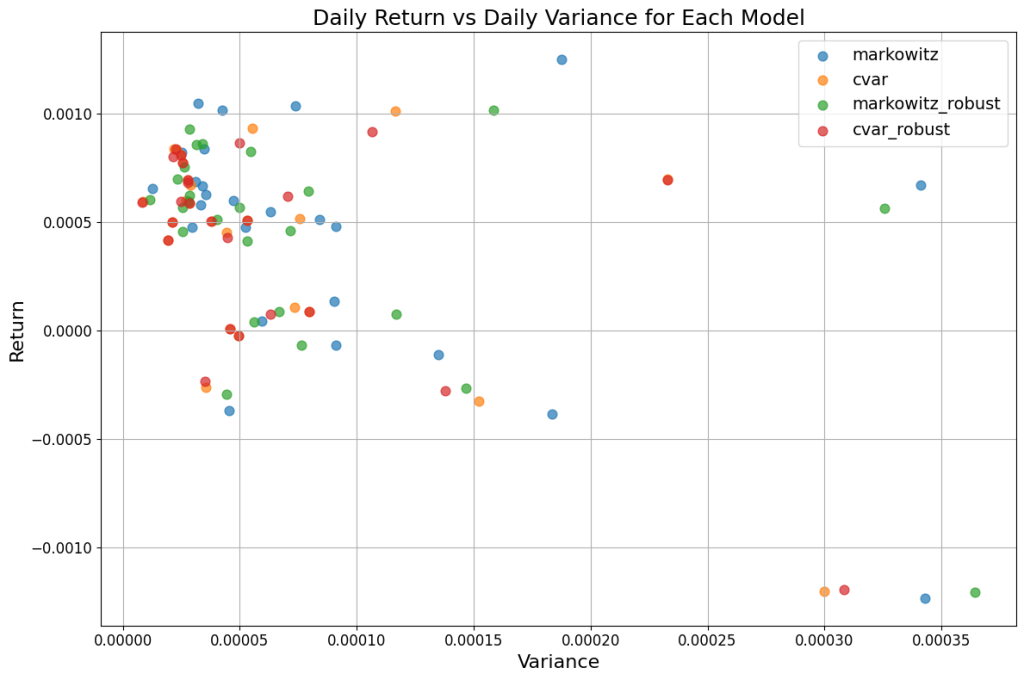
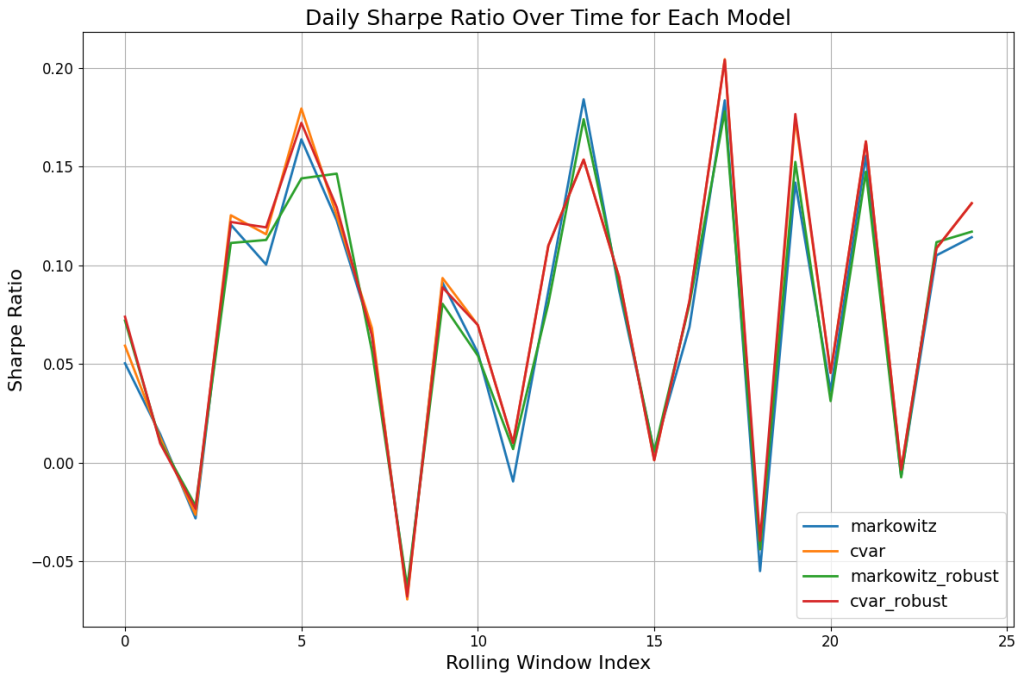
The best of the four models in the scatter plot is the robust CVaR, which has the greatest clustering in the top-left (high-return, low-variance). We are also able to pick up the 2008/2009 financial crash, shown by the four points in the bottom-right of the chart. The risk-return trade-off is similar for the four models as shown in the Sharpe ratio over time, although the CVaR maintains a slight edge over the other models in most time periods.
To further assess model performance, a copula was used to simulate returns data for testing on. A copula is a function that can model both marginal distributions as well as co-dependence structures. Forty years of data was sampled from the copula, and this was split into one-month, 21-day periods to assess short-term performance. The performances of each of the stocks are shown in the below histograms:
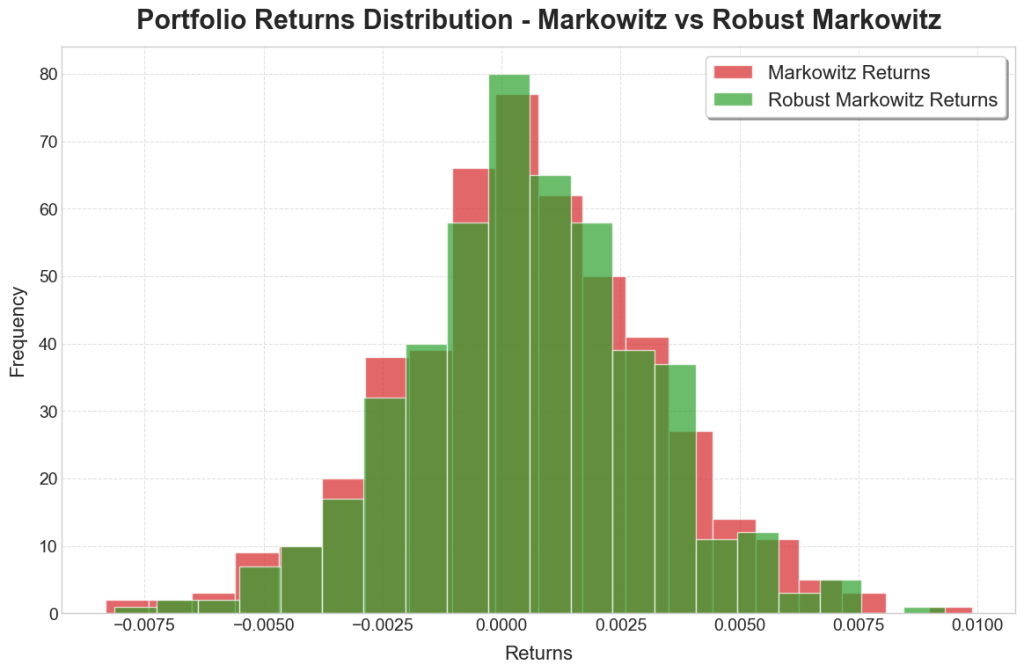
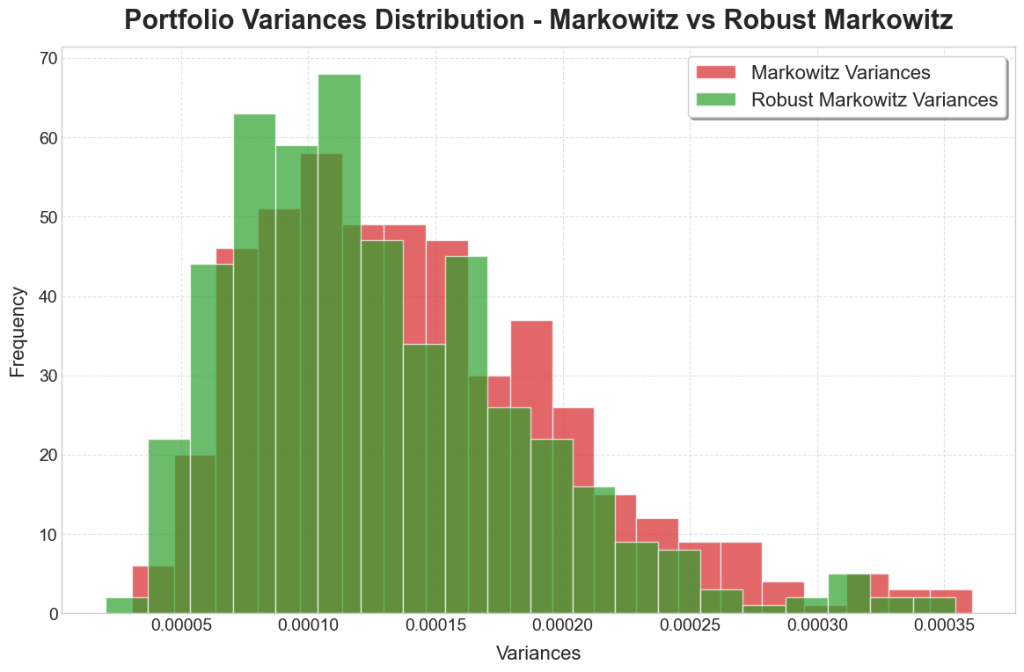
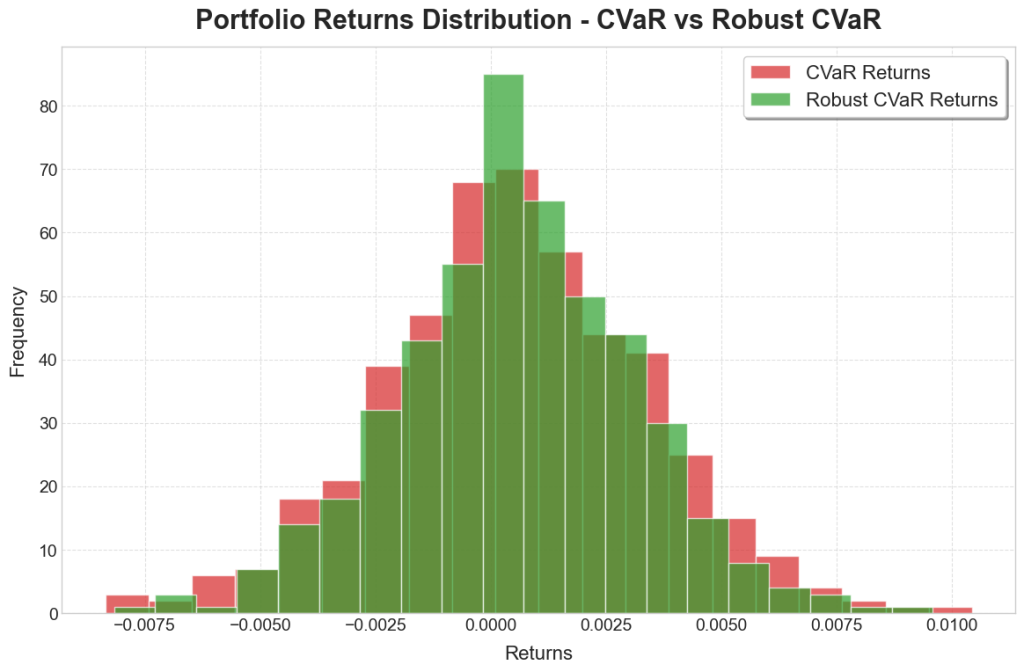
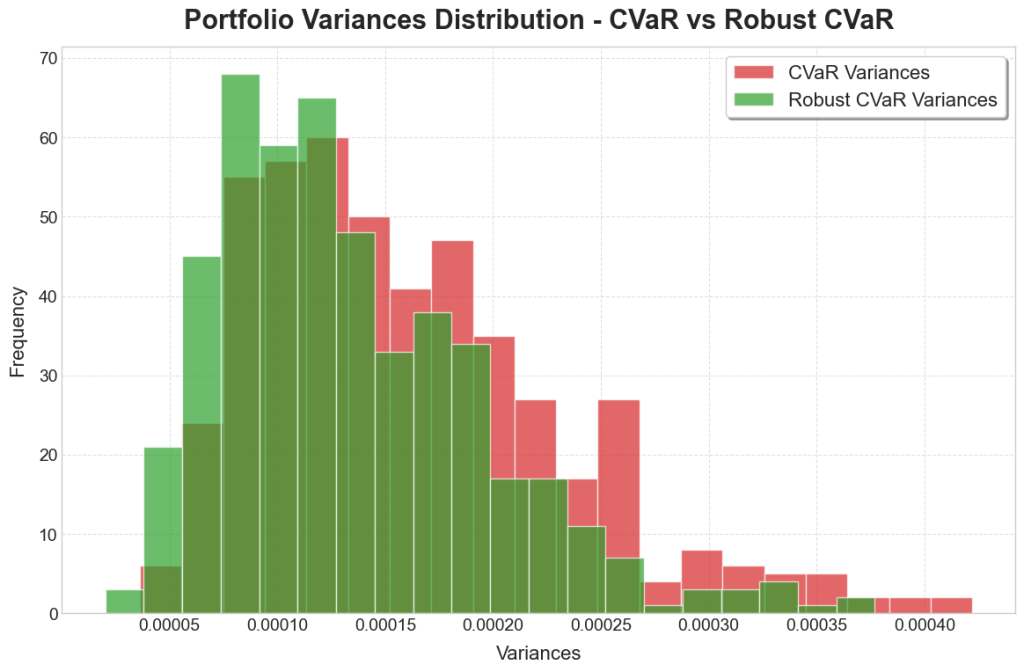
The robust models exhibited a greater concentration around the central values, resembling a t-distribution of the returns. There we also fewer values in the extremes, which is to be expected due to the extra precautions taken to ensure more security in the portfolio. Of greater interest though is the reduction in variances, with the robust models dominated by months of low variance, compared to the non-robust models having much longer tails and many months of high variance.
Th results of the report made it evident that robustness can have huge benefits when applied even to simple frameworks, and that the reduction in volatility does not need to come at a compromise to expected return.
The full report, including much more detail on data pre-processing, the models and general metrics achieved, can be found Here.