As part of my MRes year, I completed a research project looking at multi-state models and how they are used in healthcare. The aim was to create a report that could be read and understood by a general audience, mirroring those found in statistics magazines such as Impact.
The data used in the report was related to the severity of Cardiac Allograft Vasculopathy (CAV) of patients who had received a heart transplant. Post-transplant, patients went between “Well”, “Mild/Moderate”, “Severe” and “Death”, and it was of interest to see which patient covariates had the largest effect on patient health decline. The covariates considered were the patient age, the age of the heart donor, the patient sex, whether the patients were diagnosed with Ischaemic Heart Disease (IHD) prior to transplant, and the cumulative rejection episodes experienced by the patient. Models considering all combinations of the covariates were considered, and their Akaike’s Information Criterion plotted in Figure 1.

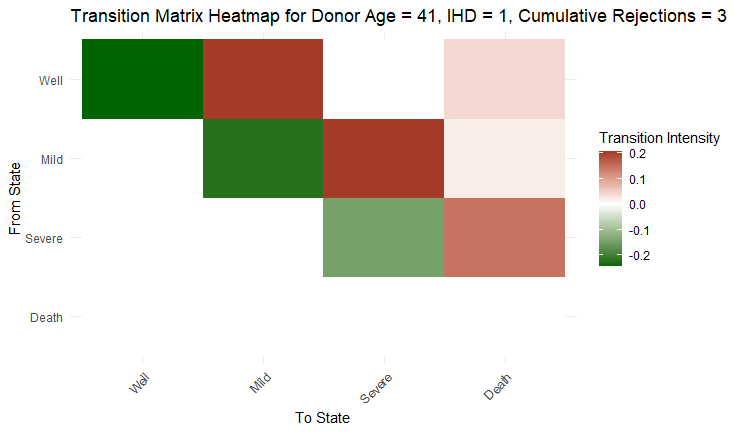
Based on this, we used a model including the age of the heart donor, the IHD diagnoses and the cumulative rejection episodes. For each, we investigated the hazard ratios between each pair of states, shown below.
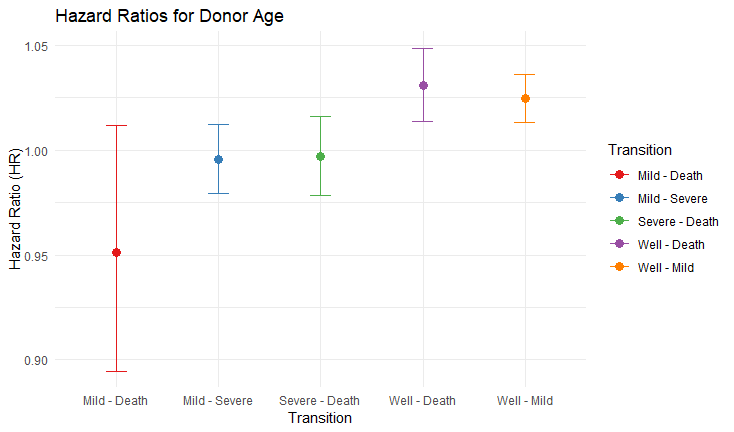
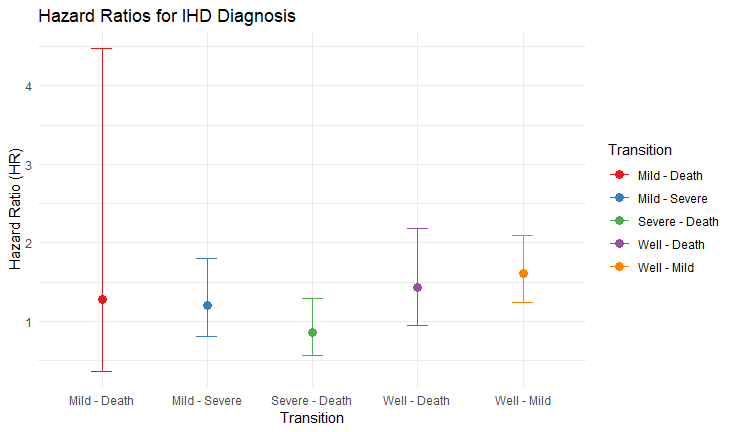
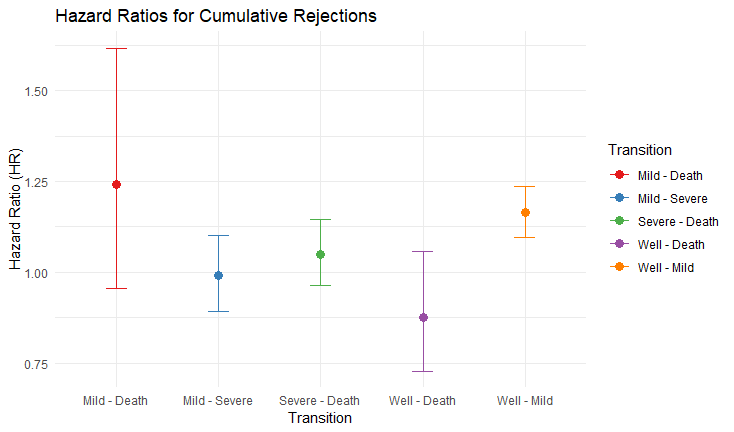
The hazard ratios, with some exceptions, generally seemed to indicate that increases in the covariate values increase the hazard. Note that the hazard ratio for the cumulative rejection episodes and for the donor age is the increase in hazard for each episode/year, whereas IHD is binary. To test our hypothesis, we took a patient in the 20th percentile of each covariate, and a patient in the 80th percentile, and evaluated their progression between states. The graphs corresponding to the patient at the 20th percentile are shown below:
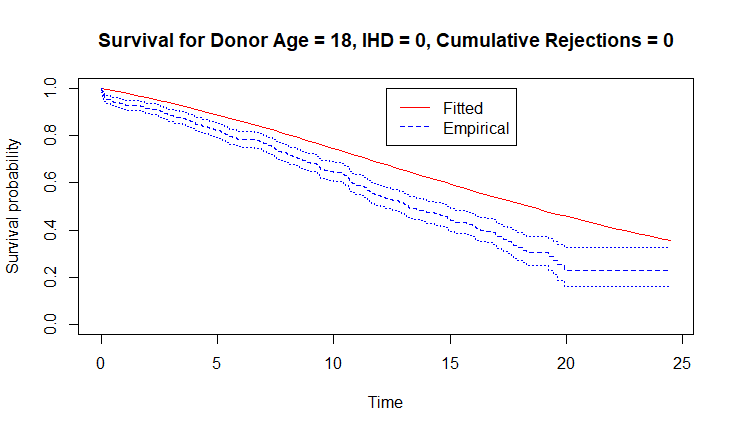
The graphs show a lower-risk profile associated with the above individual – it takes a long time for the patient to transition out of the well state, and their overall survival probability is higher than that of the overall group at all time point at a 5% level of confidence. The same graphs were also plotted for the 80th percentile individual.
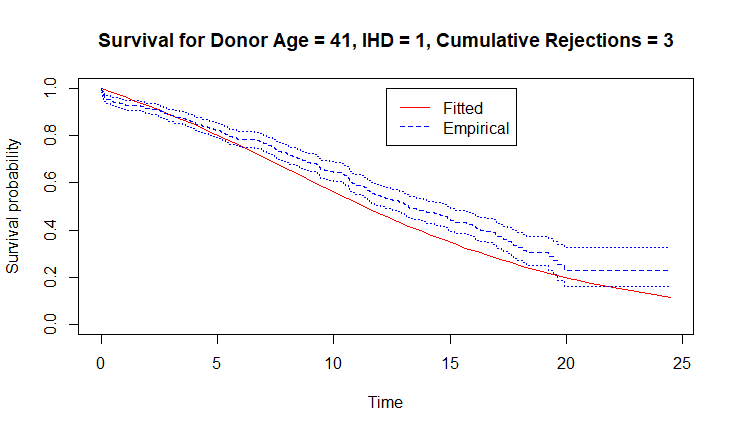
The survival in this group is comparably much lower. Particularly, there is a much shorter time spent in the well state, with greater transitions to both mild/moderate and straight to death. The survival probability is also much reduced across all time points, indicating that these covariates are indeed responsible for increased risk to patients.
Such results are useful to patients and doctors as they allow treatment to be tailored to the specific needs of the patient – patients identified as being high-risk can be afforded more appointments and stronger medication, and the lowest risk patients can be allowed fewer side-effects and a fuller life.
The full article can be found Here.