Dominic James Thomas Hardy
This research applied river channel critical node theory to four Northern hemisphere glaciers. Rivers and glaciers are branched, and where these branches meet are called nodes. Nodes have varying importance on the connectivity of the system. Those which are essential for system stability are considered critical (High importance). These points symbolise boundaries, where exacerbated changes can occur if disrupted. We investigated whether these critical nodes when related to Equilibrium-Line Altitudes (ELA) illustrate any exacerbated changes to the glacial size, extent, and thickness (mass balance). The methodology entailed using Open Global Glacier Model (OGGM) software to map glacial branches and assign which node(s) were critical, alongside mass balance data from World Glacier Monitoring Service (WGMS). Together, this enabled us to determine the scale of change in glacial mass balances when the critical node is disrupted. We found a range of 1.3 to 17.1 times exacerbated change in the net balance when the critical node was disrupted. Differences are suggested to relate to the shape of the glacier, as well as the complexity of the branches. This approach will allow glaciologists a point to reference for valley glacial dynamics as well as providing an indicator of climate change.

Dominic James Thomas Hardy
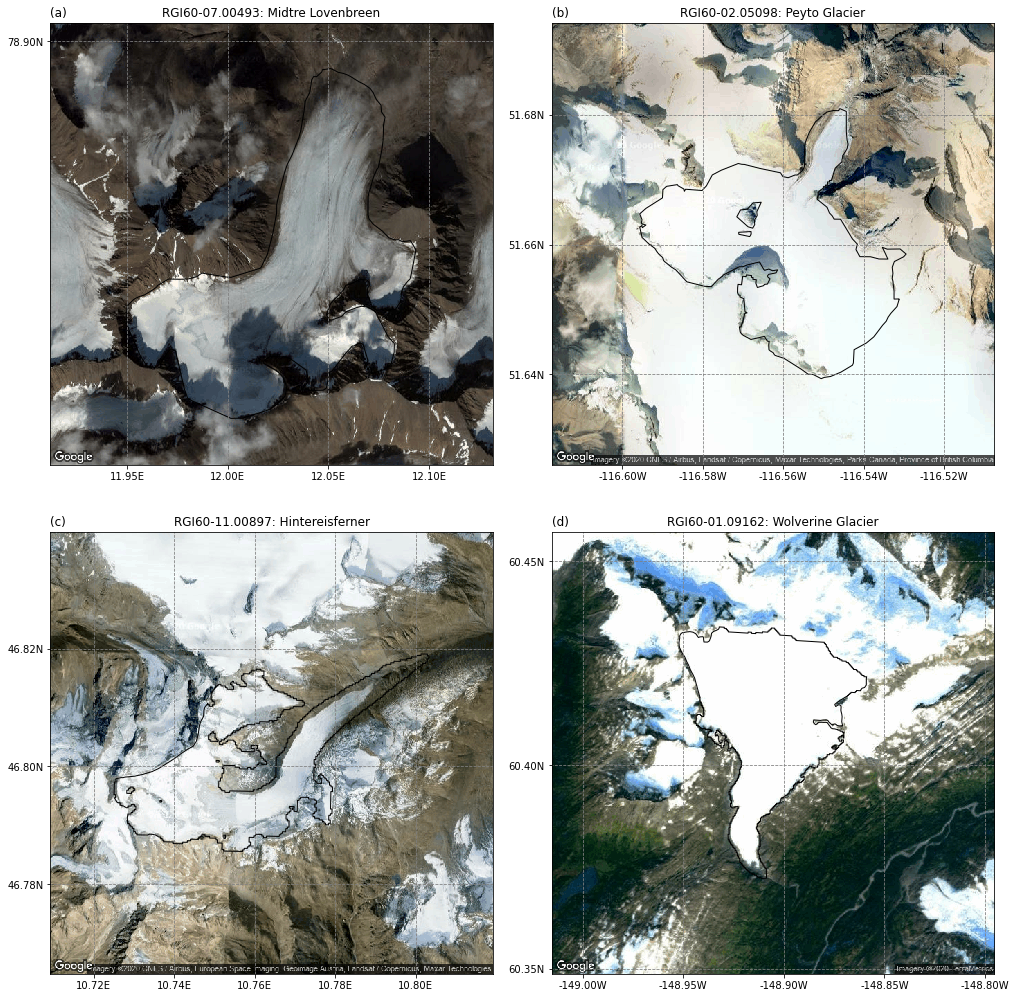
Google Earth Imagery of four Glacier Study Sites
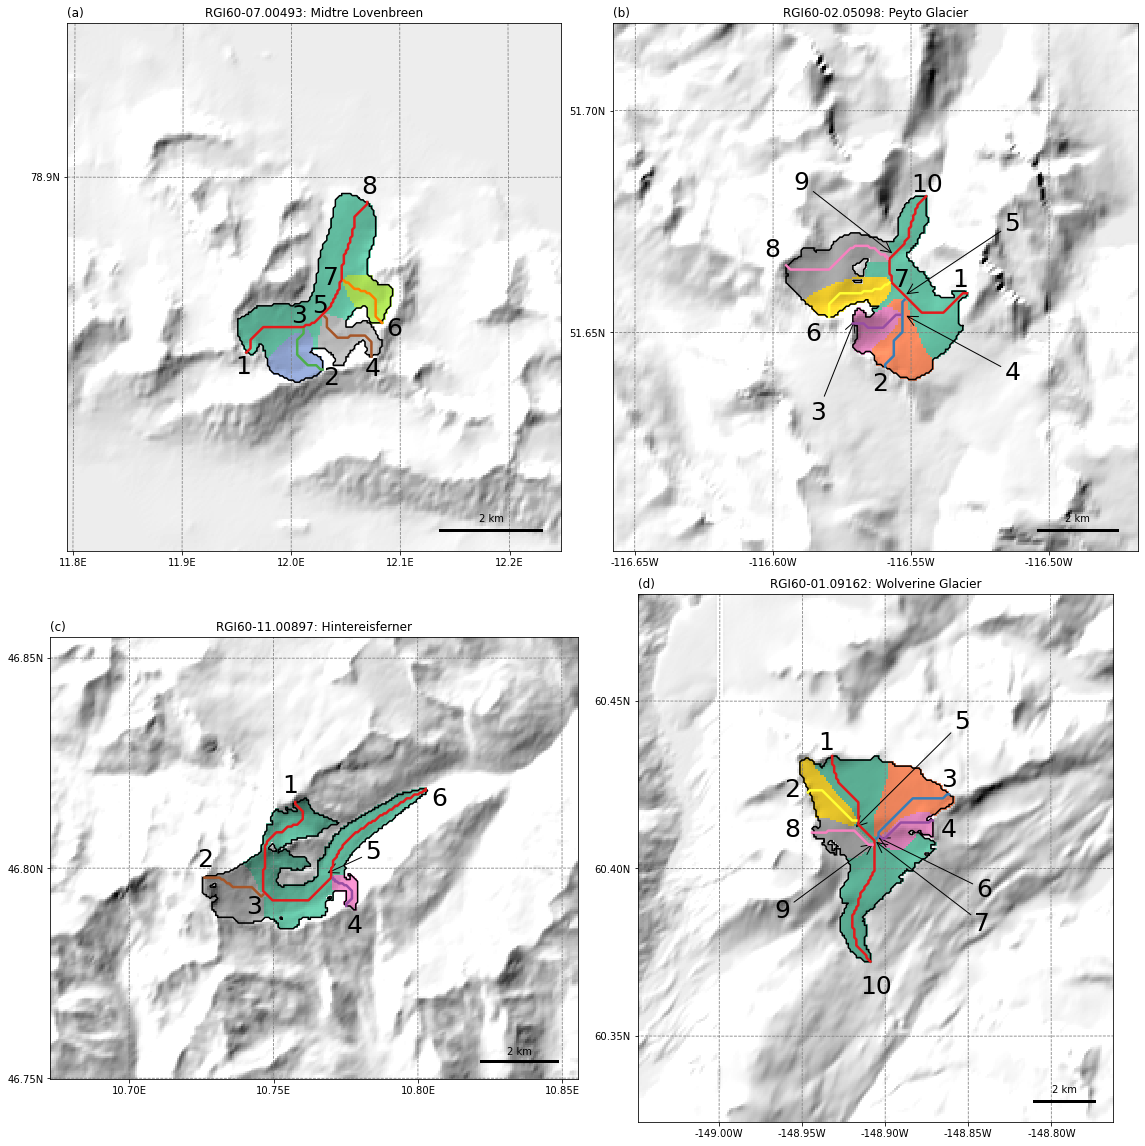
Glaciers with Centre flowlines mapped and nodes assigned
Study sites
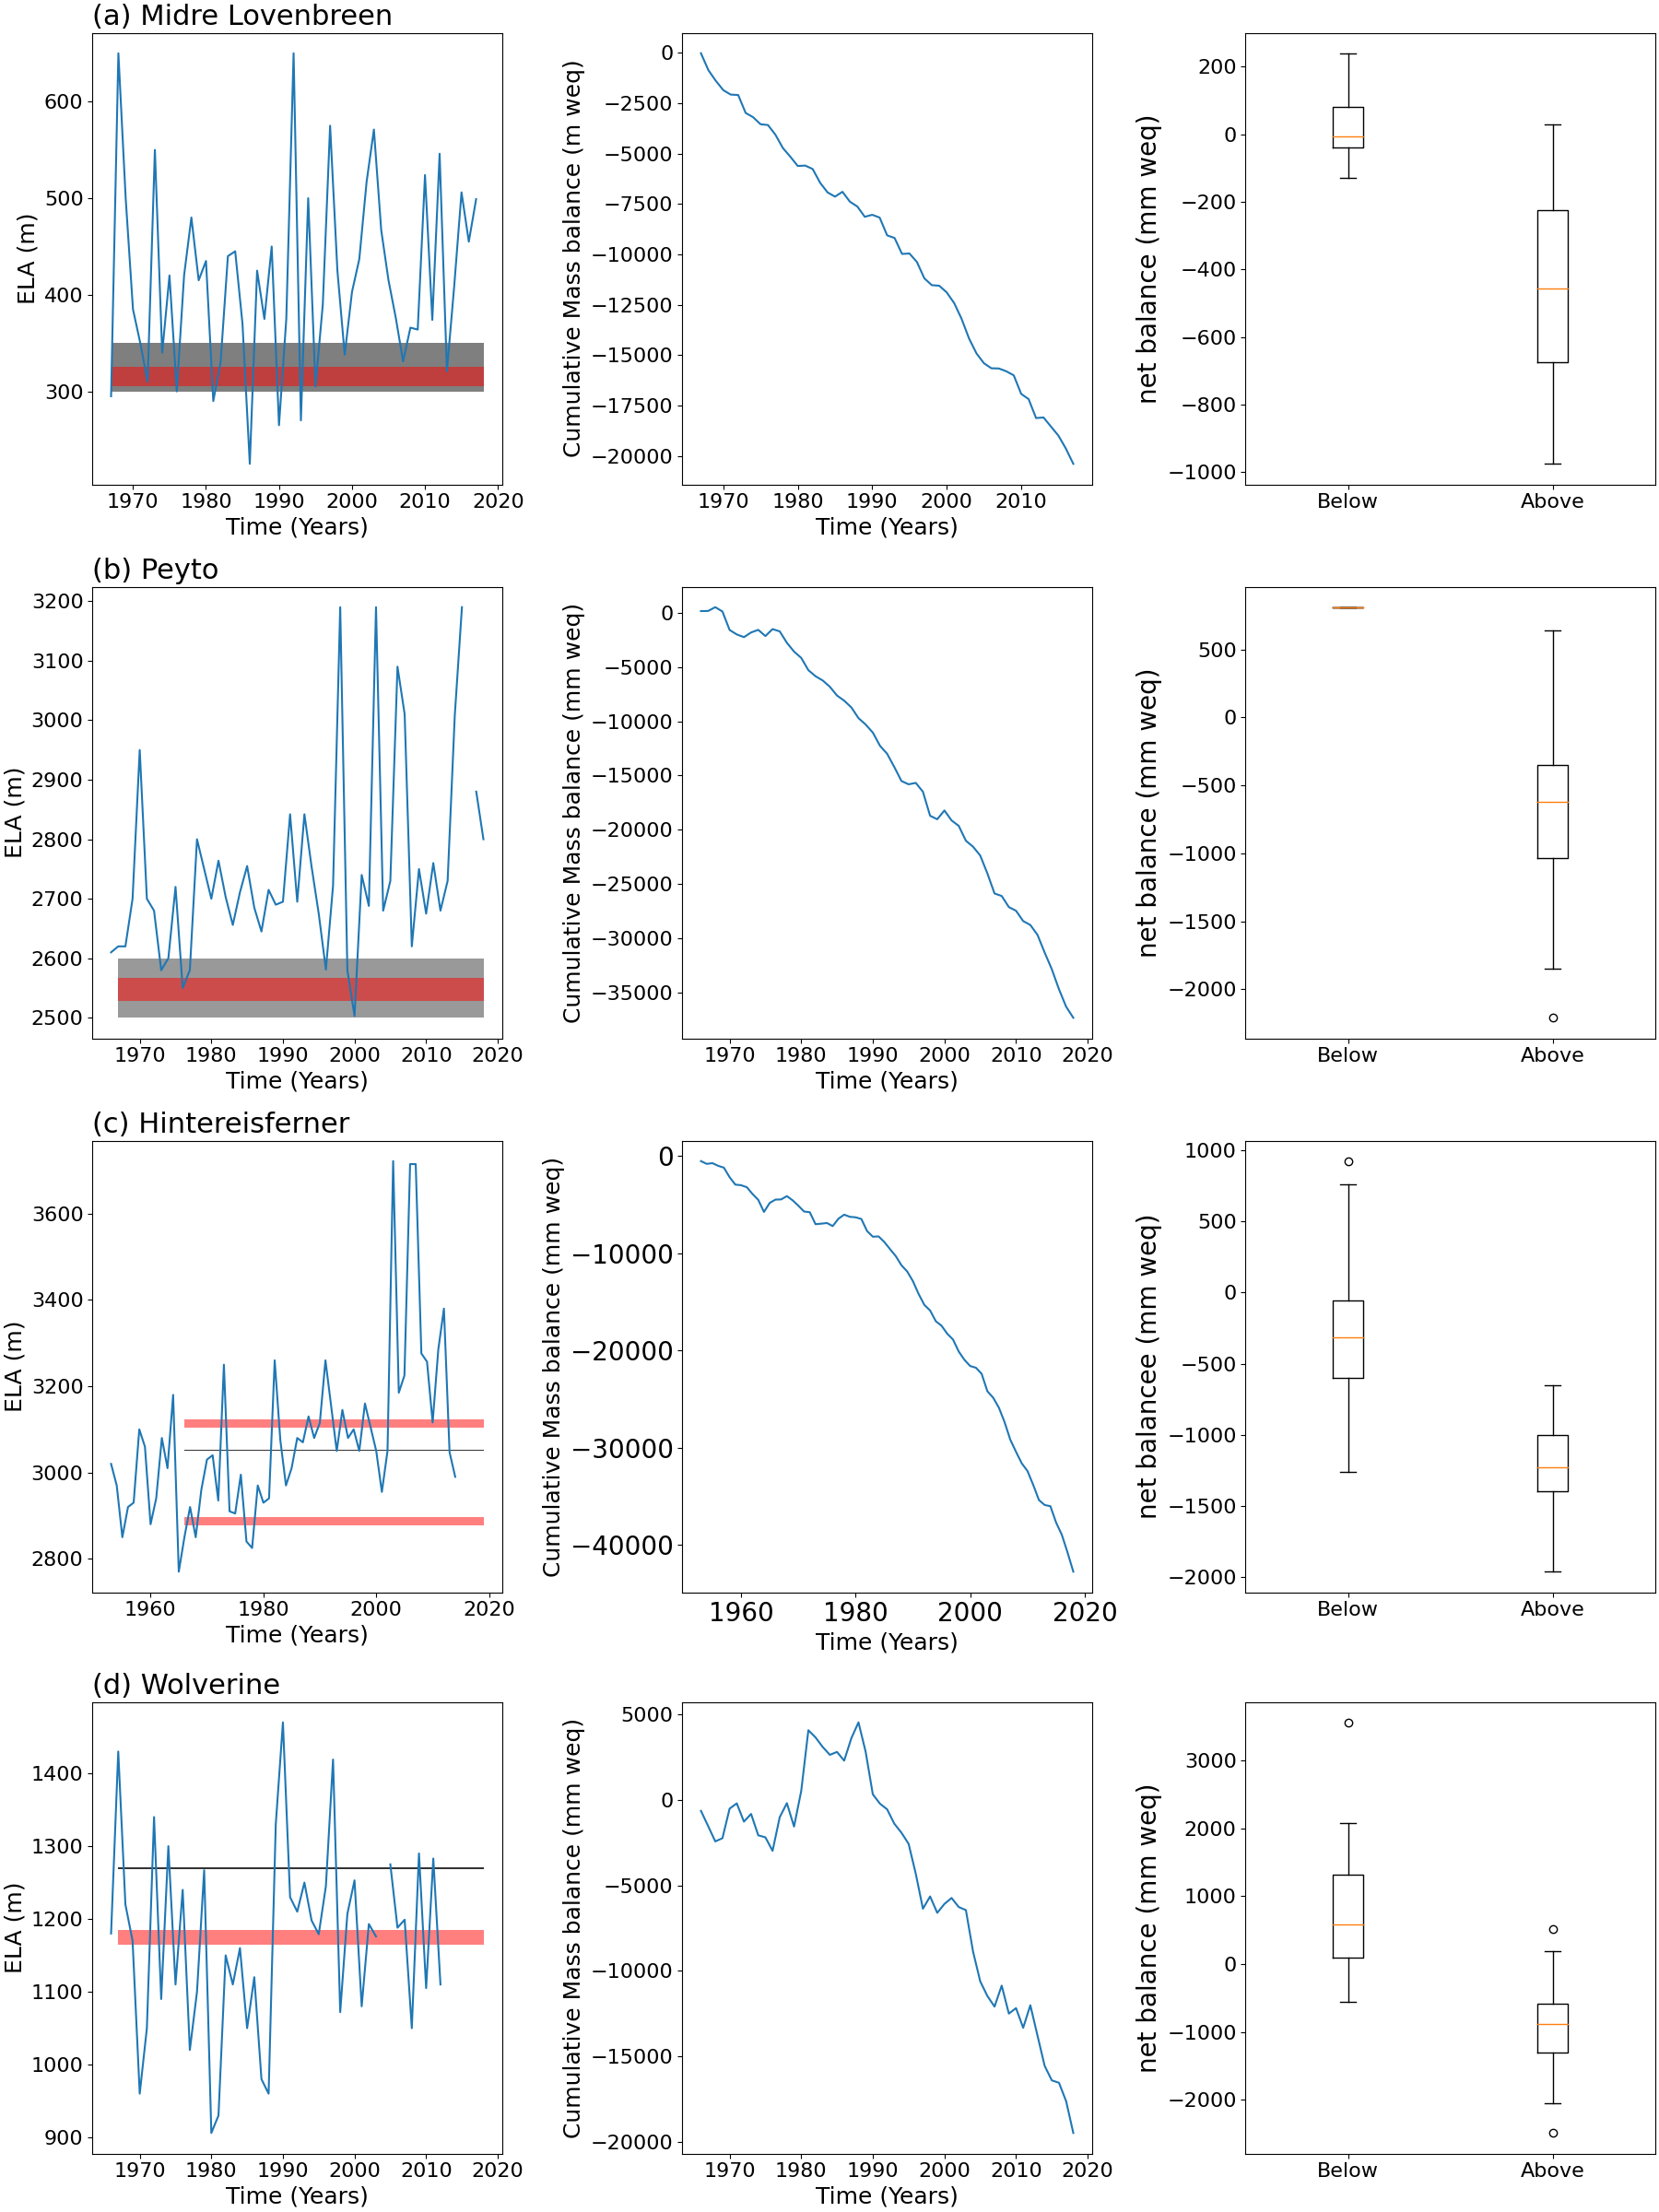
This study used 4 glaciers from the Northern Hemisphere. These are (a) Midtre Lovenbreen (Svalbard), (b) Peyto (Canada), (c) Hintereisferner (Austria) and (d) Wolverine (Alaska). These are WGMS reference glaciers as they have +30 years worth of mass balance data. This allows for long term analysis to be undertaken to establish whether our hypothesis is likely to be accepted or rejected.
Methodology
• Using Maussion et al, (2019) (OGGM) Glacial extents were established and centrelines drawn from Kienholz et al., (2014) algorithms. These were then graphically represented (Figure to right).
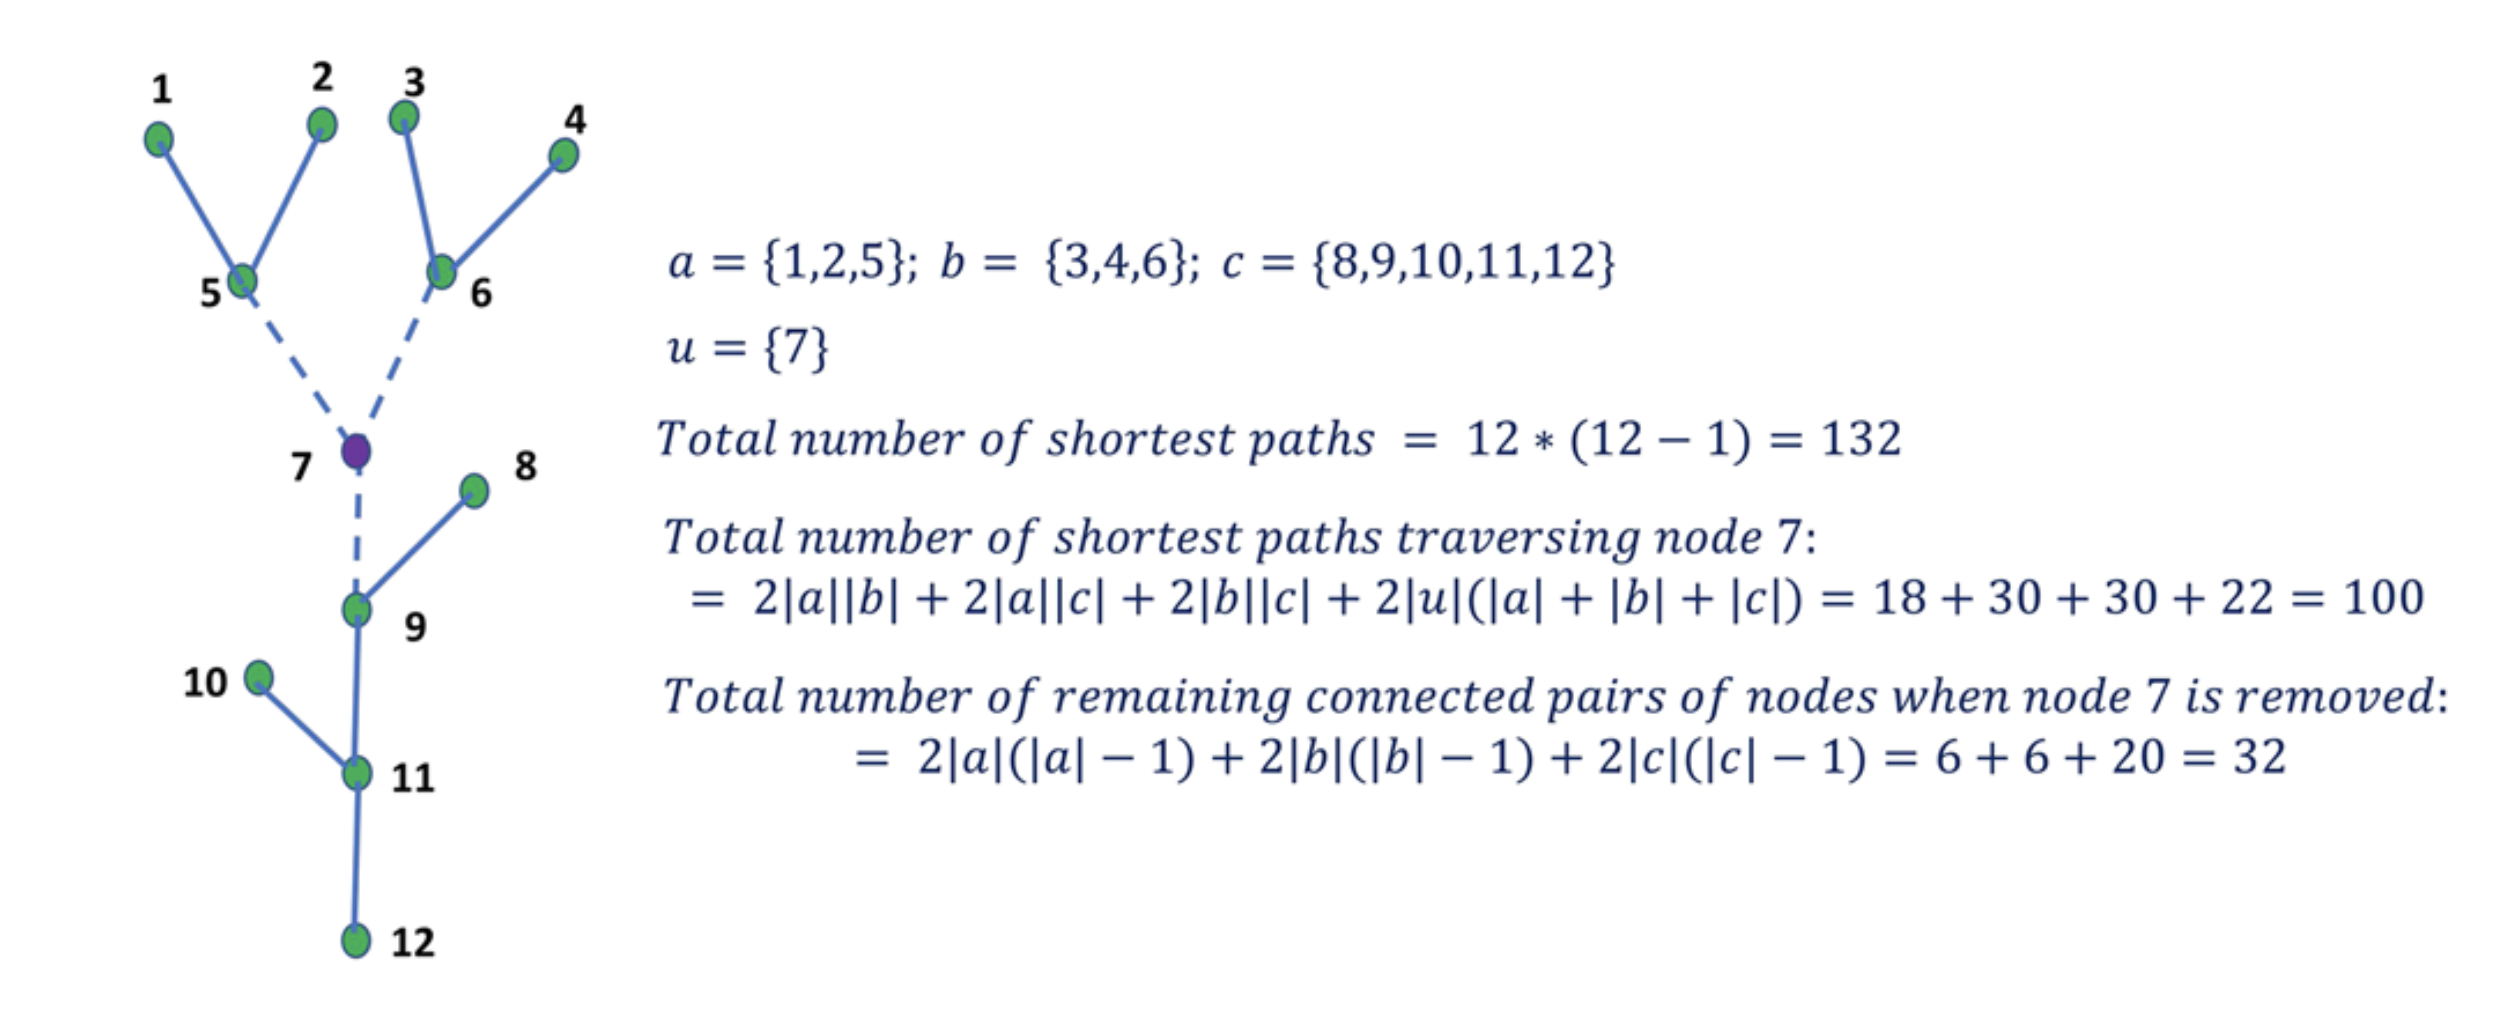
• The critical node was then identified by assessing the importance of each node within the whole ’nodal network’ by undertaking Sarker et al. (2019) method of identification. (see schematic below).
• Mass balance and ELA data between 1960 - 2018 was obtained from WGMS (WGMS, 2020).
• The Elevations of the identified critical nodes were established using DEMs and given ±10m buffer.
• The WGMS data was then split into two groups based on if the ELA was above or below the critical node. These groups were then plotted as box plots and statistically tested using Kruskal-Wallis tests.
Results
Figure above illustrates the identification of all the nodes on the glaciers. The critical nodes established where: (a) = 5, (b) = 5 &7, (c) 3 &5, (d) 7. The elevation of these were established and buffered ±10m and added to the figure to the left (red band) .
This figure suggests that when the ELA is above the critical node position the the rate of net balance changes considerably this is particularly exemplified by Wolverine (d) where the graphs suggest phases of drastic changes and stabilisation which coincides with the relative position of the ELA to the critical node.
Our results from kruskal-Wallis testing (Table 1) suggests that only Peyto failed to reach the 95% threshold and therefore, is inconclusive about establishing scale of exacerbated changes failing our hypothesis. The others appear to pass our early hypothesis suggesting that there is some link between the critical nodes and exacerbated changes.
Discussion
- Critical nodes appear to be linked or influenced by the hypsometric median value (Figure above (Left column, black band)). This is interesting as the hypsometric median is linked with glacial sensitivity. Confirming the idea that these critical node points are threshold values to changes in glacial dynamics and extent, thickness (geometry). The extent to which these are linked is still unclear.
- Reasoning behind Peyto failing to meet threshold significance is due to only 1 value being below the critical nodes calculated therefore providing insufficient data. Furthermore, arguably the wrong nodes were selected as critical. Peyto has a weird and unconventional spherical rather than linear shape. We suggest that node number 4 is more critical particularly long term. This new node does exhibits significance at the 95% threshold and suggests a scaling factor of 3.3 times. A very realistic outcome.
- The scaling factors we found had a large range. The range presnting some unrealistic outcomes notably Midtre Lovenbreen. Therefore, we should take these values with caution. However, the range may represent the different environmental conditions at each site. Furthermore the shape of the glaciers may also be a factor. Reasoning behind Wolverines low scaling factor is due to it being a 'stable' glacier and consequently would expect little change unless considerablly affected by climatic forces. More conclusive refined data would better conclude the excaerbated change from critical node disruption. Data specifically at the critical node margin would be useful. Despite this it does highlight the importance of these positions as reference points of glacial conditions/'health' as significant changes do occur in years where the ELA is above these points.
References
Kienholz, C., Rich, J. L., Arendt, A. A., and Hock, R.(2014). A new method for deriving glacier centerlines applied to glaciers in Alaska and northwest Canada, The Cryosphere, 8, 503–519, https://doi.org/10.5194/tc-8-503-2014, 2014
Maussion, F., Butenko, A.,hampollion, N.,Dusch, M., Eis, J.,Fourteau, K., Gregor, P., Jarosch, A. H., Landmann, J., Oesterle, F., Recinos, B., Rothenpieler, T., Vlug, A., Wild, C. T. and Marzeion, B. (2019). The Open Global Glacier Model (OGGM) v1.1, Geoscientific Model Development. pp.909-931. Available at: https://www.geosci-model-dev.net/12/909/2019/ , DOI: 10.5194/gmd-12-909-2019
Sarker, S., Veremyev, A., Boginski, V. and Singh, A., 2019. Critical Nodes in River Networks. Scientific Reports, 9(1).
Conclusions
- This is only early investigations and methodology concepts. Closer observations need to be established with better more concise data. Particularly geodentic data of the mass balance at the margins of these critical nodes to be absolutely certain that cataytlic changes occur when these critical nodes are comprimised ('disconnected'). However, the real success was using OGGM we can identify these critical node locations. Furthermore, our results do appear to sugest that the identified critical nodes are threshold point at which exacerbated changes in mass balance does occur. The scale to which varies between glaciers shape and complexity. Overall, this study does proivide evidence that Sarket et al., (2019) critical node theory can be applied to glaciers to assess glacial dynamics.
- Future Studies could try using surface velocities using InSAR to clearly confirm if during these ’disconnection’ events where the critical node is comprimised do excaerbated changes occur. This would be identified by sudden changes in surface velocity.
Kind thanks to Dr. Wynn and Dr. Folkard for helping me turn these abstract concepts into logical reasoned ideas.
Introduction
Sarker et al., (2019) established a method of identifying within a river channel network the point, which if lost or disconnected would lead to catastrophic system affects. Valley glaciers have similar simplified networks and if this method was applied would also indicate a critical point on the glacier. Characterisation of nodes are: either the starting point of a tributary or the point where two central flow lines meet (Point where branches start and join).
This study aimed to primarily establish whether the principle of Sarker et al., (2019) theory of critical nodes can be applied to glaciers by:
(i) establishing the critical node position on a glacier
(ii)Analysing the influence of this position in relation to the ELA and testing the hypothesis:’If the ELA is above the critical node the glacier is ’disconnected’ and exhibits exacerbated changes in the mass balance’.
Inspiration to Project
Whilst undertaking a module on Glacial and fluvial processes I was introduced to a theory by Sarker et al., Which identified critical parts of a river network and assessed if these critical points if disrupted caused drastic changes to the river processes. As a Glaciologist i thought how this system thinking could be applied to branched glaciers notably those in valley settings as a means to provide a new framework of thinking for glacial dynamics and monitoring of health/condition. Having utilised OGGM before i thought this tool would help visulaise my abstract concept. The research i present here is the primative ideas of my concept and since applying to present here my ideas have devloped. I provide insight into these developments in the conclusion.