LANCASTER UNIVERSITY 2022 UNDERGRADUATE RESEARCH CONFERENCE
15th MARCH - 17th MARCH 2022
Dani Kennedy

Dani Kennedy

Engineering (Bailrigg) | Year 4 | Degree: Mechanical Engineering
The extraction of Uranium from seawater using a biomass sorbent: dynamic tests in lab

Our project is centred around creating a prototype model that measures seawater after interaction with biomass-filled sorbent bags within a container (batch). The prototype will down-scale the cooling seawater downstream from a nuclear power facility (cooling water pool) with the addition of sorption material. The composition of seawater and numerous sensors positioned after the sample will contribute to the analysis of uranium that has been sorbed onto the biomass in the contacted bags in the batch. The understanding that certain biomass species attract uranium particulates exposes a possibility of scaling the prototype to nuclear power stations in the UK. The detection of uranium contents in seawater via a self-designed: optical filter (covering a large spectrum where uranium presents the best absorption), photodiode detection of excited uranium emitted photons and transistor amplification circuit. This research has led to an exciting challenge of U emission lifetimes in seawater due to the formation of Uranyl Calcium Carbonate that may be analysed in detail. Discoveries made could aid in formulating new and exciting nuclear fuel extraction methods that are sustainable and fully renewable.

Dani Kennedy
 
Dani Kennedy

Dani Kennedy, Stephen Byrne, Ryan McAtasney

Engineering (Bailrigg) | Year 4 | Degree: Mechanical Engineering
The extraction of Uranium from seawater using a biomass sorbent: dynamic tests in lab
<
>
   
Introduction:        The switch to renewable energy is fast becoming a reality but concerns are prominent relating to sustainability and cost. Nuclear fuel is a viable alternative but only if the method of extraction is safe and tenable. Uranium exists in seawater in quantites of 3ppb which makes extraction complicated. A secondary barrier lies in the inability to measure uranium content in-situ and in small volumes. Methodologies that currently exist are unfeasible, unstable, and are difficult to integrate into a functioning system. The premise of this project is to build off of the extraction of uranium using a biomass sorbent, and the creation of new and effective techniques to measure, and detect the quantity of extracted uranium automatically.

Nuclear energy is a growing sector around the world due to the demand for new renewable energy sources. The conversion of nuclear energy is completed using steam turbines and a cold source, often in the form of cold water. In order to run sustainably the conversion process also requires the utilisation of uranium to be successfully implemented. Uranium exists in miniscule quantities in seawater but can be recovered and re-worked into the system to produce a fully sustainable process. In nuclear energy, molten salt reactors (MSRs) are used to produce heat but also transporting it to the power plant. An efficient MSR consumes a minimum amount of fuel (i.e., uranium) whilst still producing a maximum amount of thermal and electrical energy. The best way to achieve this is through strict neutron economy to favour fission rather than capture through the use of fast neutrons.

In 2020, 16% of the UK's electricity was supplied using nuclear power plants. There are 13 operational sites in the UK which are highly regulated in terms of their energy output, both thermal and electrical. The majority of UK sites are AGR (advanced gas cooled reactors), but this will eventually become phased out due to the shift towards the use of PWRs (pressurised water reactors). The system being produced in this project, is being designed with the intention for application in a range of reactor types. Key aspects for the prototype are centred around keeping price low and easy implmentation, therefore, the compactness and portability of the device are critical.

Figure 1 : Process of nuclear energy conversion using a coolant source

Uranium in Seawater:       Uranium is dissolved in seawater at very low concentrations, only about 3 parts per billion (3 mg/l). However, accounting for the shear volume of ocean water results in approximately 4 billion tonnes of uranium in the ocean at any given time. In the United States, the average reactor produces 1-GW per year. This mass of uranium alone is capable of fuelling a thousand of these 1-GW nuclear power plants for 100,000 years. Biosorption is a physiochemical process that occurs naturally in certain biomass which allows it to passively concentrate and bind contaminants onto its cellular structure. The use of biowaste is an economic and eco-friendly solution. The biomass materials are abundant and readily available, even to be procured as waste products from existing industries. Biosorption is also able to occur in very dilute aqueous solution making it suitable for the low concentrations of uranium in seawater. C.Degueldre concluded that with regard to uranium uptake in seawater, chlorella cells and orange peel are best suited for use in seawater, hence the utilisation of orange peel in the present study.

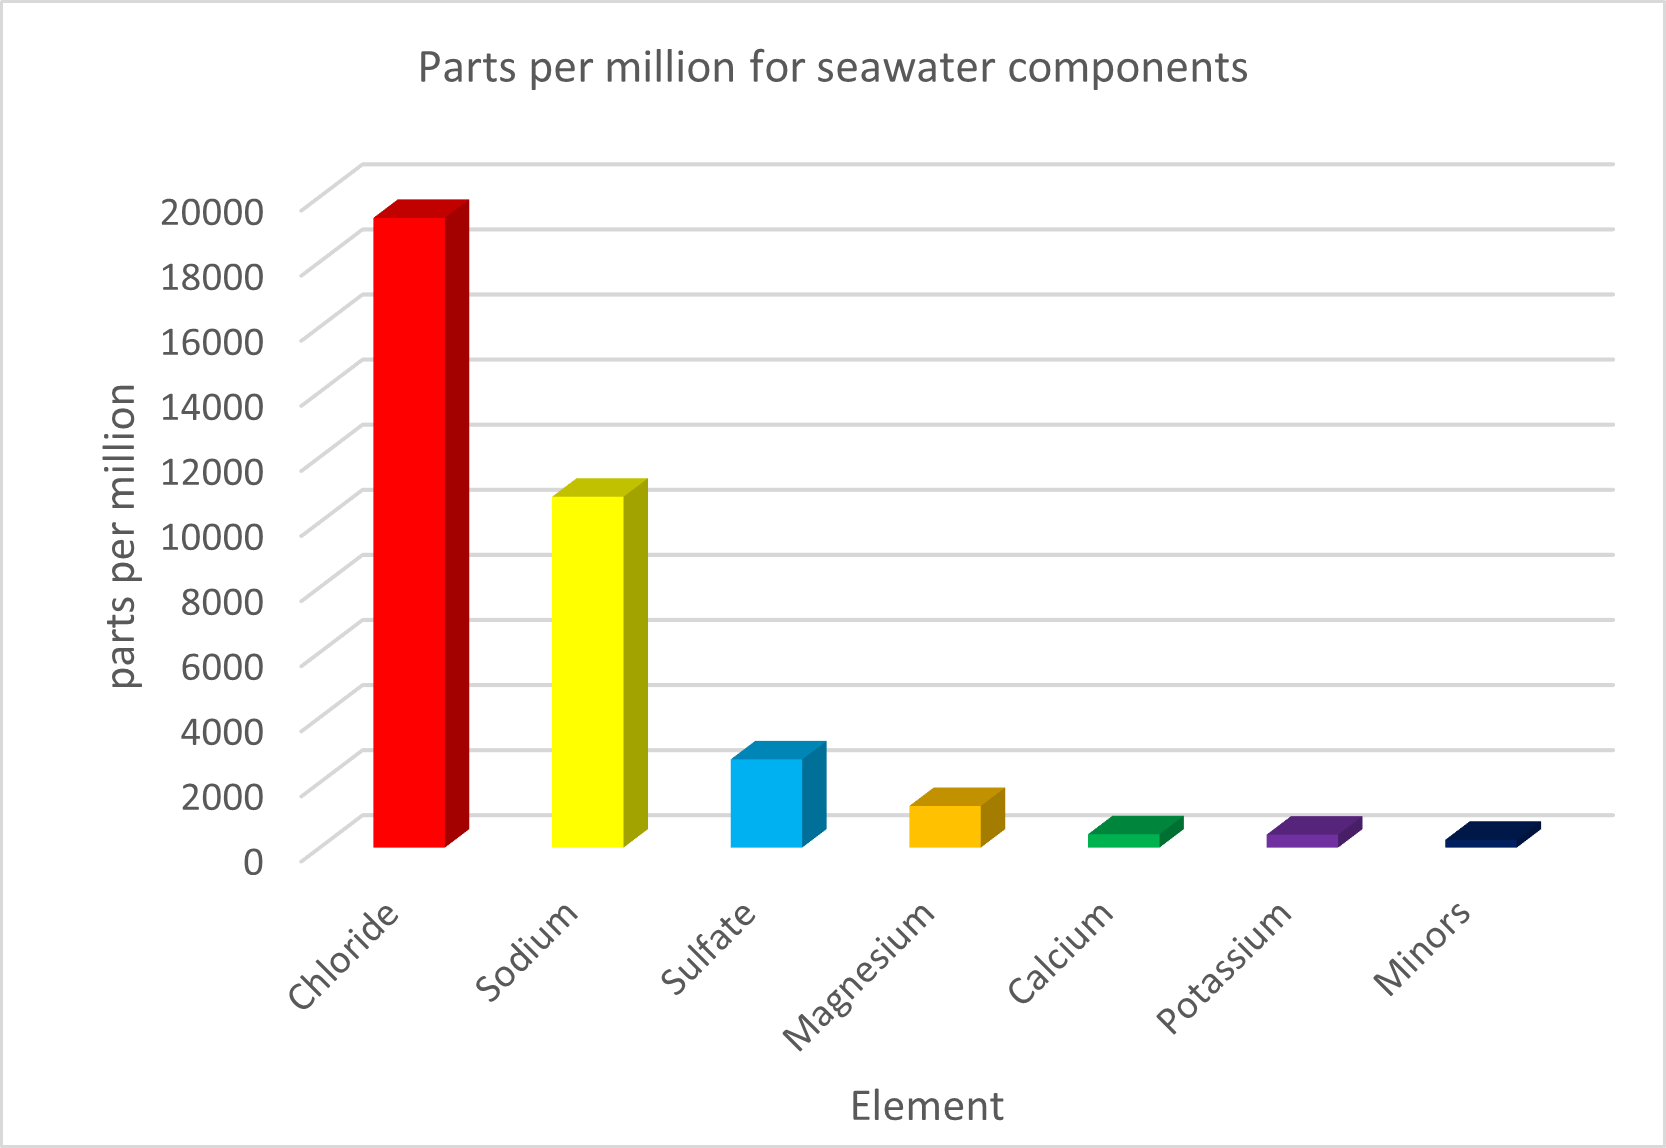
Figure 2: Constituents of seawater, measured in parts per million (ppm)

Case Study:       AGRs make up the majority of operational nuclear power stations in the UK and they follow predefined standards relating to power output and coolant flow rate. Each of the power stations in the UK house 2 reactor units that produce power that corresponds to the graph seen in Figure 3. The intention of this project is to scale the discovered equipment to nuclear power stations in the UK, and therefore, a scale factor linking the stations had to be calculated. This scale factor was utilised to approximate the flow rate in the laboratory based on the volume of water in use. The amount of uranium extracted in the lab can be scaled up to estimate how much could be removed by the power stations and understand the amount to energy that this corresponds to. The water tank in the experiment can hold 110L of water, and the knowledge that the resisdence time is consistent between the site in Heysham and our experiment here in Lancaster, a flow rate of 0.0862L/hr was found.  The flow rate of water through the system will be of low magnitudes in order to achieve a simulation spanning over a duration of multiple months. For this reason, a pumping mechanism will be required which can maintain a consistent outflow from the 110L water tank to the other constituents of the system. Research found that a peristaltic pump is the most viable option for this application due to its ability to pump extremely low volumes of water at regular intervals. The pump will be implemented between the 110L storage tank and the filtration container through a series of pipes. Pressure sensors will also be present at different stages within the system to monitor the changes to flow rate and therefore assisting in the identification of leaks or blockages.

Figure 3 : Stacked graph showing the power outputs for different UK nuclear power stations

LAB SETUP The experimental setup implemented in the lab, was modelled in CAD for fast export into CFD for analysis. Figure 4 displays a step-by-step of the flow of seawater through the system. The process begins with an 110L soft plastic tank; this is representative of the coolant source, and in the case of Heysham this will be Morecombe Bay. The next stage is the peristaltic pump (*not shown in diagram*) which controls the volume of water flowing through the system in an effort to resemble the flow rates experienced in the nuclear power plant. The water of specified flow rate then enters a collection chamber which also acts as a filtration system. The first box shaped element can hold a maximum of 3L and houses bags filled with biomass to act as a sorbant. Two streams exit this box. One holds the sensory units, which analyse the oxygen content, conductivity, pH, and turbidity of the seawater once it has interacted with the biomass. The second outlet takes the form of a fluorometer. Fluorometry works under the principle of fluorosence so the base and the optical equipment are encased in a custom made black box.

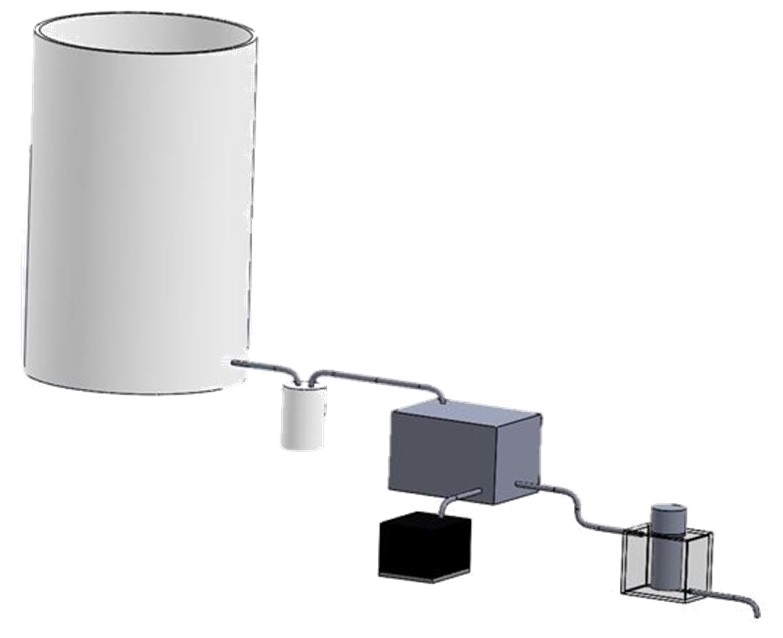
Figure 4 : CAD model of the laboratory setup required to achieve downhill flow

MEASURING U CONTENT
The measurement of the Uranium content in the seawater is a crucial part for this project and the scaling to future sites. Its importance is because Uranium content varies depending on the parameters of the seawater, such as: pH, temperature, salinity and deepness the water is collected at. The variation of U content in seawater worldwide means having a cheap, accurate method of measuring is required for screening at every potential site where the U sorption method is utilised.
FLUOROMETER
The chosen method of U measurement is time resolved fluorescence spectroscopy by creation of a novel, cheap and small sized fluorometer. The fluorometer requires key parts:
  • Excitation Source
  • Excitation Path guidance
  • Photon detectors
  • Analysis circuitry

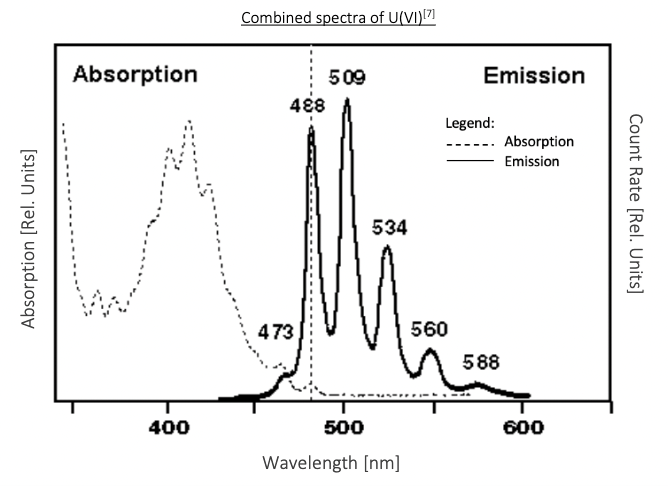
Figure 5 : Excitation and Emission Peaks for Uranium

Uranium fluorescence is a well-studied field; it is known to emit fluorescent photons when absorbing incoming light photons; U has specific peaks where fluorescence is more likely. The excitation and emission peaks are best seen in Figure 5; and correspond to a desired excitation wavelength of between 390nm – 430nm and emission detection wavelength of 480nm – 550nm. The excitation source accounts only for the absorption required – there are two options, laser or LED as the excitation source. The decision was made for LEDs to be used as UV LEDs paired with a blue light LED can cover the whole spectrum required (with filtering of higher wavelength light); whereas a laser light source typically only covers a wavelength with range of 5nm as a maximum. With the decision to use LEDs, fibre optics were no longer an option for filtering light; thus, classical optical physics needed to be used to achieve the desired wavelength reaching the seawater sample. The first step was achieving convergence of the light emitted from the LEDs as LED light is not focused and spreads with its associated viewing angle – a bi-convex lens is an easy fix and the first step to understanding this is Snell’s law:  

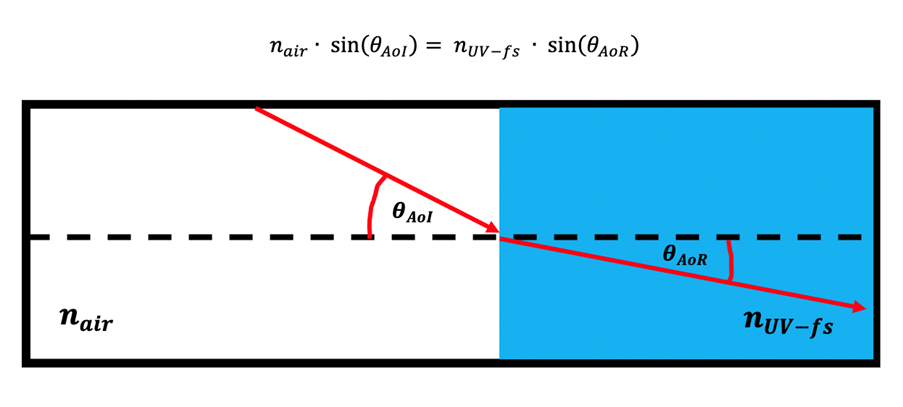
Figure 6 : Principles of Snell's Law

From this a focused beam of light can be achieved; however, filtering remains a task. To achieve this, a high pass dichroic beam splitter ideally with a cut off frequency at 430nm is designed. As it is high pass, wavelength above the cut-off passes through whereas our desired light is reflected to the sample at 90 degrees – a 3d model is seen Figure 7.

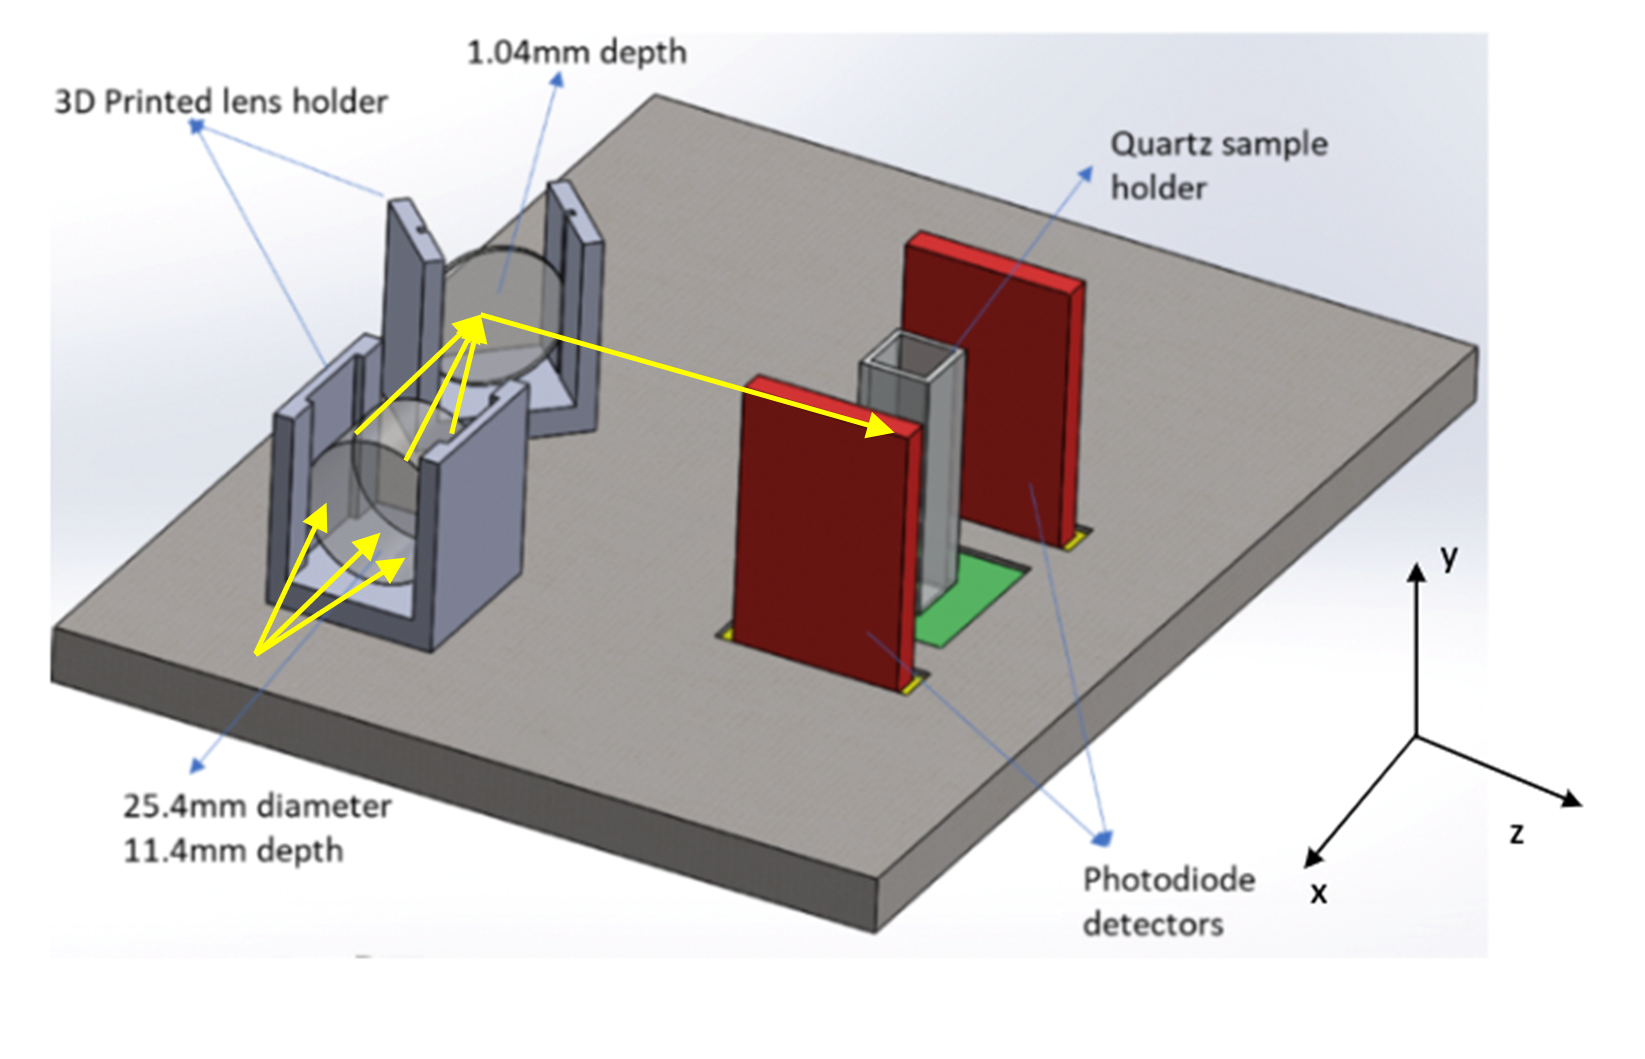
Figure 7 : Lens setup used in laboratory, created in CAD

The final points of understanding the optical physics utilised, was the lens makers equation and the conjugate ratio. The lens makers equation allows the calculation of a focal point (the point where all light converges) and the conjugate ratio simply states that for 2 focal points to remain equal on two different optical filters, they should be an equal distance from each other along the normal plane of light.
Detection of the fluorescent photons was a choice between many well-known instruments/ devices in the field. It was decided that photodiodes would be used for their small size, high QE and cheap cost. However, it is also decided to compare results between photodiode detection and PMT detection because photodiodes require electrical gain circuitry that gives rise to electrical noise that can distort the output signal – PMT gain is mechanical but still subject to noise. The photodiodes use can best be seen via its use in the analysis circuitry; however, again an option is required to use op-amps or transistor amplification. Transistor amplification was chosen because it is not subject to the high input delays that plague op-amp circuits, the calculation for gain is even simpler than op-amp gain, the transistor input voltage was small (<5V compared to op-amp- 12V<) meaning for future scaling of the fluorometer, less power is required. The image below, simply shows the resistance Rx is the only variable that inputs gain, thus is simple to modify. And detection is completed with fluorescent photons generating a current in the photodiode detectors that lowers the Vout.

Vout = 5V - (Rx * Itot)

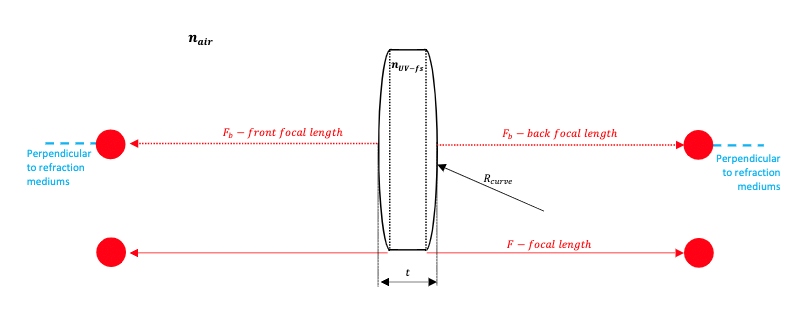
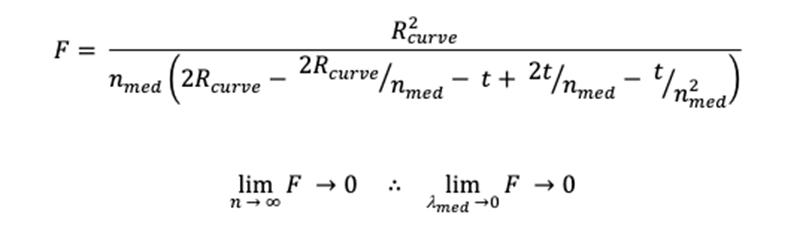
Figure 8 : Determination of lens focal point

Figure 9 : Circuitry for the implementation of four pulsing photodiodes in parallel

ADDITIONAL SENSORS
  • Calibration: The calibration process is essential for ensuring that the electrodes are behaving as expected, hence making sure that the readings being observed are accurate. Also, electrodes have been observed to become less effective over time and the resistance changes, so it is important to check regularly for this. The entire system should be periodically recalibrated to ensure that values being recorded are always correct.
  • pH: The pH of seawater ranges between 7.5 to 8.5 dependent on its local salinity and levels will increase with salinity until the water reaches calcium carbonate saturation. Studies into the removal of uranium from aqueous mediums have concluded that pH affects uranium biosorption by both microorganisms and biowastes such as orange peel. M.A Mahmoud found that percent of uranium removal from seawater onto orange peel was at its’ lowest at low pH’s (1-3) before increasing until a maximum at a pH of 4. This is due to the hydrogen ions competing with uranium ions for adsorption sites within the orange peel. However, after pH 4 the percent of removal was found to gradually decrease from 95.50% to 75.45% at a pH of 8. This is a consequence of the formation of stable complexes with carbonates such as UO2CO3 and [UOZCO3]2- in more alkaline conditions.
  • Oxygen Potential: The amount of dissolved oxygen in seawater greatly depends on the types of life forms present as well as the photosynthetic activity. The oxygen content is of interest in this study because it will inform as to whether or not the growth of bioorganic life is increasing, and this may have an effect on the uranium content within the seawater. In the laboratory setting there is unlikely to be much fluctuation, however upon scaling up this variation and subsequent effects will be more pronounced.
  • Salinity: Typically, a conductivity sensor is used to measure salinity because a direct link can be drawn between the amount of electrical current being detected and the salt content present in a medium. Seawater is not uniformly saline throughout the world, with the main determining factor being the relative evaporation and precipitation of an area. The depletion of salt dilutes the concentration of uranium in the seawater which is significant for the real-world application with regards to ideal locations/depths to place biomass sorbents. There is also an implication for the collection of seawater in this study, ensuring that it is not diluted by recent precipitation.
RISK MITIGATION
A 'teabag' like structure was utilised to hold the sorbent material as you want the water to be able to penetrate the sorbent but you do not want the biomass to escape into the flow. The pores in the bag are of lower enough diameter to ensure that this is the case. CFD is essential for the study to ensure that the sorbent bag will not rupture under standard velocities. Figure 10 shows the porosity study undertaken on a small portion of the bag to study the volume of water, velocity, and pressure change over time. 

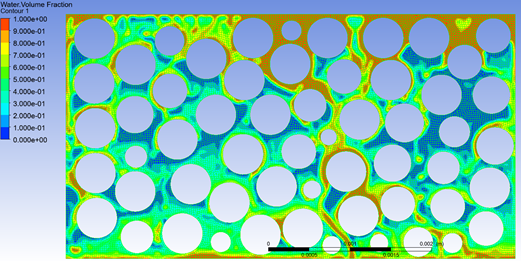
Figure 10 : Porosity study for sorbent bag, undertaken using CFD

A further CFD study was undertaken, looking primarily at the fluid movements entering and leaving the container holding the sorbent bags. Each of the containers is joined using 10mm tubing which are secured by air-tight seals. Water inflow speeds will be controlled but it is important to understand what would happen if fluid flow dramatically increased and therefore predict the likelihood of a burst pipe due to high pressures. The container was modelled and subject to water speeds over 100 times faster than expected to identify areas of high pressure and measure the maximum height that the water level will rise to. This knowledge will help us to position the sorbent bags so that they are consistently submerged in seawater.

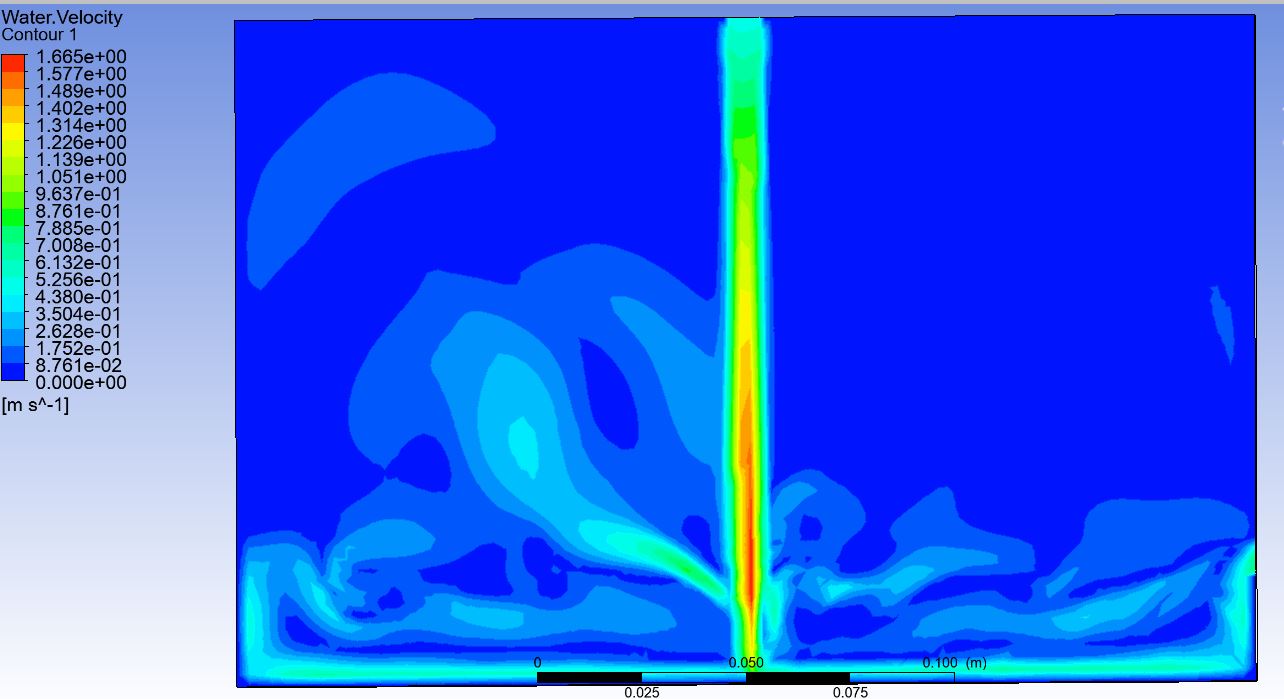
Figure 11 : Water tank simualtion, undertaken using CFD

As the setup cannot be monitored 24/7, it is important that we can be made aware of any issues that arise so they can be adjusted accordingly. An additional consideration could be the implementation of complete automation through feedback loops and control valves.
  • Turbidity: A turbidity sensor is used in order to ensure that the teabag structure encasing the biomass remains intact as a tear would increase the turbidity of the water. An increase in turbidity above a pre-determined threshold triggers an alarm notifying about the potential issue which can then be resolved. In an experiment in the Kinta River, Selamat et al found a strong correlation of 0.915 between the concentration of uranium with turbidity. This is a further reason to monitor turbidity in the study.
  • Level: In order to prevent damage to the probes on the sensory unit, they must be submerged in water/encased in solution at all times. Therefore, an additional risk aversion measure is taken with the installation of a level sensor external to the box. This device will send push notification to mobile devices through Arduino, alerting the group to potential issues so they can be adjusted accordingly.
PARSIMONY Due to the cost associated with current methods of uranium extraction, a key aspect is to ensure costs are kept as low as possible. Multiple steps have been taken to achieve this including:
    • LED array instead of xenon lamp
    • Photodiodes for detection instead of more expensive methods such as a PMT
    • Electing to 3D print holders, box for minimal cost rather than purchasing
    • Continuous modification of fluorometer design, swapping out expensive mirrors
    • Using readily available departmental apparatus wherever possible
 

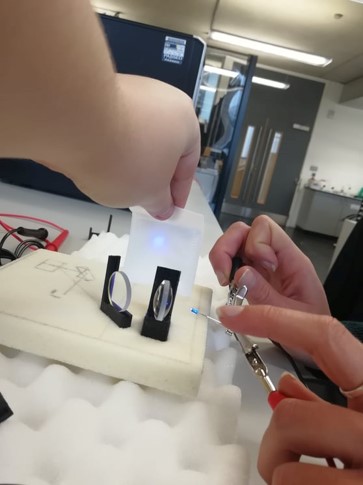
Figure 12 : Light convergence through lenses; prototype setup on foam

Please wait, saving page...
Add default layout Add text Add image/symbol Add audio/video
Preview page
CloseCanvas height (pixels)
Background colour
Background image (max: 2mb)
Clear
Drop files here to upload
CloseEmail Website address Facebook Twitter Instagram Profile image
Close
Slide 1 image (max 2mb)
Clear
Drop files here to upload
Slide 1 video (YouTube/Vimeo embed code)
 
Clear
Image 1 Caption
Slide 2 image (max 2mb)
Clear
Drop files here to upload
Slide 2 video (YouTube/Vimeo embed code)
 
Clear
Image 2 Caption
Slide 3 image (max 2mb)
Clear
Drop files here to upload
Slide 3 video (YouTube/Vimeo embed code)
 
Clear
Image 3 Caption
Slide 4 image (max 2mb)
Clear
Drop files here to upload
Slide 4 video (YouTube/Vimeo embed code)
 
Clear
Image 4 Caption
Slide 5 image (max 2mb)
Clear
Drop files here to upload
Slide 5 video (YouTube/Vimeo embed code)
 
Clear
Image 5 Caption
Slide 6 image (max 2mb)
Clear
Drop files here to upload
Slide 6 video (YouTube/Vimeo embed code)
 
Clear
Image 6 Caption
Slide 7 image (max 2mb)
Clear
Drop files here to upload
Slide 7 video (YouTube/Vimeo embed code)
 
Clear
Image 7 Caption
Slide 8 image (max 2mb)
Clear
Drop files here to upload
Slide 8 video (YouTube/Vimeo embed code)
 
Clear
Image 8 Caption
Slide 9 image (max 2mb)
Clear
Drop files here to upload
Slide 9 video (YouTube/Vimeo embed code)
 
Clear
Image 9 Caption
Slide 10 image (max 2mb)
Clear
Drop files here to upload
Slide 20 video (YouTube/Vimeo embed code)
 
Clear
Image 10 Caption
Caption font Text
CloseImage (max size: 2mb)
Clear
Or drag a symbol into the upload area
Image description/alt-tag Image caption Image link Rollover Image (max size: 2mb)
Clear
Or drag a symbol into the upload area
Border colour
Rotate
Skew (x-axis)
Skew (y-axis)
CloseVideo/audio player embed code (YouTube/Vimeo/Soundcloud)
Rotate
CloseText Rollover Text Background colour
Rotate
CloseText Rollover Text Background colour
Rotate
CloseText Rollover Text Background colour
Rotate
CloseImage (max size: 2mb)
Clear
Drop files here to upload
Or drag a symbol into the upload area
Image description/alt-tag Image caption Image link Rollover Image (max size: 2mb)
Clear
Drop files here to upload
Or drag a symbol into the upload area
Border colour
 
Rotate
Skew (x-axis)
Skew (y-axis)
CloseText Rollover Text Background colour
Rotate
CloseText Rollover Text Background colour
Rotate
CloseText Rollover Text Background colour
Rotate
CloseText Rollover Text Background colour
Rotate
CloseImage (max size: 2mb)
Clear
Drop files here to upload
Or drag a symbol into the upload area
Image description/alt-tag Image caption Image link Rollover Image (max size: 2mb)
Clear
Drop files here to upload
Or drag a symbol into the upload area
Border colour
 
Rotate
Skew (x-axis)
Skew (y-axis)
CloseImage (max size: 2mb)
Clear
Drop files here to upload
Or drag a symbol into the upload area
Image description/alt-tag Image caption Image link Rollover Image (max size: 2mb)
Clear
Drop files here to upload
Or drag a symbol into the upload area
Border colour
 
Rotate
Skew (x-axis)
Skew (y-axis)
CloseText Rollover Text Background colour
Rotate
CloseText Rollover Text Background colour
Rotate
CloseText Rollover Text Background colour
Rotate
CloseText Rollover Text Background colour
Rotate
CloseText Rollover Text Background colour
Rotate
CloseText Rollover Text Background colour
Rotate
CloseImage (max size: 2mb)
Clear
Drop files here to upload
Or drag a symbol into the upload area
Image description/alt-tag Image caption Image link Rollover Image (max size: 2mb)
Clear
Drop files here to upload
Or drag a symbol into the upload area
Border colour
 
Rotate
Skew (x-axis)
Skew (y-axis)
CloseText Rollover Text Background colour
Rotate
CloseImage (max size: 2mb)
Clear
Drop files here to upload
Or drag a symbol into the upload area
Image description/alt-tag Image caption Image link Rollover Image (max size: 2mb)
Clear
Drop files here to upload
Or drag a symbol into the upload area
Border colour
 
Rotate
Skew (x-axis)
Skew (y-axis)
CloseImage (max size: 2mb)
Clear
Drop files here to upload
Or drag a symbol into the upload area
Image description/alt-tag Image caption Image link Rollover Image (max size: 2mb)
Clear
Drop files here to upload
Or drag a symbol into the upload area
Border colour
 
Rotate
Skew (x-axis)
Skew (y-axis)
CloseText Rollover Text Background colour
Rotate
CloseText Rollover Text Background colour
Rotate
CloseText Rollover Text Background colour
Rotate
CloseText Rollover Text Background colour
Rotate
CloseImage (max size: 2mb)
Clear
Drop files here to upload
Or drag a symbol into the upload area
Image description/alt-tag Image caption Image link Rollover Image (max size: 2mb)
Clear
Drop files here to upload
Or drag a symbol into the upload area
Border colour
 
Rotate
Skew (x-axis)
Skew (y-axis)
CloseImage (max size: 2mb)
Clear
Drop files here to upload
Or drag a symbol into the upload area
Image description/alt-tag Image caption Image link Rollover Image (max size: 2mb)
Clear
Drop files here to upload
Or drag a symbol into the upload area
Border colour
 
Rotate
Skew (x-axis)
Skew (y-axis)
CloseText Rollover Text Background colour
Rotate
CloseImage (max size: 2mb)
Clear
Drop files here to upload
Or drag a symbol into the upload area
Image description/alt-tag Image caption Image link Rollover Image (max size: 2mb)
Clear
Drop files here to upload
Or drag a symbol into the upload area
Border colour
 
Rotate
Skew (x-axis)
Skew (y-axis)
CloseImage (max size: 2mb)
Clear
Drop files here to upload
Or drag a symbol into the upload area
Image description/alt-tag Image caption Image link Rollover Image (max size: 2mb)
Clear
Drop files here to upload
Or drag a symbol into the upload area
Border colour
 
Rotate
Skew (x-axis)
Skew (y-axis)
CloseText Rollover Text Background colour
Rotate
CloseImage (max size: 2mb)
Clear
Drop files here to upload
Or drag a symbol into the upload area
Image description/alt-tag Image caption Image link Rollover Image (max size: 2mb)
Clear
Drop files here to upload
Or drag a symbol into the upload area
Border colour
 
Rotate
Skew (x-axis)
Skew (y-axis)
CloseText Rollover Text Background colour
Rotate
CloseText Rollover Text Background colour
Rotate
CloseText Rollover Text Background colour
Rotate
CloseText Rollover Text Background colour
Rotate
CloseText Rollover Text Background colour
Rotate
CloseText Rollover Text Background colour
Rotate
CloseText Rollover Text Background colour
Rotate
CloseText Rollover Text Background colour
Rotate
CloseImage (max size: 2mb)
Clear
Drop files here to upload
Or drag a symbol into the upload area
Image description/alt-tag Image caption Image link Rollover Image (max size: 2mb)
Clear
Drop files here to upload
Or drag a symbol into the upload area
Border colour
 
Rotate
Skew (x-axis)
Skew (y-axis)
CloseText Rollover Text Background colour
Rotate
CloseText Rollover Text Background colour
Rotate
GO TO CONFERENCE