Descrete Hopsital Queues
12th March 2016
As I mentioned in my last post (Infinitely Many Doctors? Hmmm...), the MRes are currently undertaking a research project into one of
the areas presented to us earlier in the term. My topic is infinite server queues and particularly looking at how they can be used within the Health Service. The
last blog was talking about queues in continuous time and went over the theory behind them as well as one application of it to A&E departments in a hospital. My
research has, however, also discovered
another strand of theory that I would like to share with you in this blog. This has mainly been pioneered by
Professor Martin Utley and the late Professor Steve Gallivan of the
Clinical Operational Research Unit at University College London.

In the setting of a hospital ward, the instantaneous demand for beds is generally less important than the planning of admissions and discharges that happen on
a daily basis. From the ward’s perspective, it would be reasonable to count the days that a bed is occupied by a patient rather than looking at hours minutes and
seconds. In that case, it makes sense that one only measures time discretely in days. Then the arrival rate is simply the average number of people to be admitted on
that day, which may vary day to day. This is exactly the approach Utley and Gallivan took when modelling these problems. It is assumed that there is infinite capacity
in any system, particularly the number of beds, which is how it comes under my remit! It is also assumed that all patients have lengths of stay that are taken from the
same distribution. This can be relaxed to having classes of patients but we will focus on i.i.d. service times in this blog post.
Unlike the case for A&E services, the number of arrivals is not a Poisson random variable. There are emergency admissions to wards, $i_d$, which can be estimated by a Poisson
random variable, but wards also have booked admissions which are definitely not Poisson. One can either assume that all $N_d$ booked patients turn up, in which case it
is deterministic, or that there is a probability, $v$ of a booked patient not turning up, in which case the number of booked admissions is $Binom(N_d,v)$. In either case,
the total number of arrivals on day $d$, $a_d$, is not Poisson. This will make all the analytical calculations very difficult if one were to consider just the distributions
themselves. However, Utley and Gallivan had the clever idea of building everything through the Probability Generating Functions (PGF) of the relevant random variables.
The PGF, $Z$ of a discrete random variable $z$ is a power series defined as
$$Z(s) = \sum_{i=0}^\infty \Pr(z=i)s^i.$$
This contains all of the information of the distribution, but can be used to make complicated problems simpler (and vice versa). The power series is only finite for
$-1< s <1$ but that is generally unimportant. Also, $s$ has no physical meaning and is just a convenient mathematical tool. The use of the PGFs in the papers by Utley
and Gallivan is in combining the random variables together using standard known results for PGFs.
Firstly, we start with a binary variable, $x_b$, that denotes whether or not a patient occupies a bed $b$ days after being admitted. This is a Bernoilli random variable
with success probability $p_b$ and so, if one wants to consider the contribution to the occupied beds on day $d$ from the admissions $b$ days before, $h_{db}$, it is given
by the sum over $a_{d-b}$ Bernoulli random variables. That is, $h_{db}$ is Binomial with PGF
$$ H_{db}(s) = [v + (1-v)(1-p_b +p_bs)]^{N_d}\sum_{i=1}^\infty \Pr(i_d=i)( 1-p_b +p_bs )^i.$$
Things carry on in a similar manner, combining different random variables until one obtains the PGF for the number of beds occupied. Quite simply, the number of beds occupied
on day $d$, $t_d$, is the sum over the number of beds occupied by the arrivals on each day before $d$. It is a well-known result that if random variables $a$ and $b$ have PGFs
$A(s)$ and $B(s)$, and random variable $c=a+b$, then $c$ has PGF $C(s)=A(s)B(s)$. This means that $t_d$ has a PGF
$$T_d(s) = \prod_{b=0}^d H_{(d-b)b}(s).$$
Though these expressions look quite complicated, they can be calculated relatively easily. The inputs can be obtained directly from the data, with no need to estimate the
distributions (though of course that could be done too). The only remaining task to complete is to work out how many beds are required. All the information about the distribution
of $t_d$ is given by $T_d(s)$. Therefore if one has a capacity of $B$, then one can easily calculate the probability that a day will require more than $B$ beds using $T_d(s)$.
Plots like the one shown can help in that and can be generated easily from the distribution of $t_d$. The hospital looks at the proportion of days that they want to cover (which
should probably be at least 90%, if not more), then uses the graph to decide how many beds they need.
The lack of assumptions of distributions on the length of stay and arrival process makes this method quite adaptable. It can be applied to a variety of situations. It has many
advantages over the continuous method in certain situations, but it does have limitations. I cannot imagine that it would be very useful when looking at A&E arrivals…
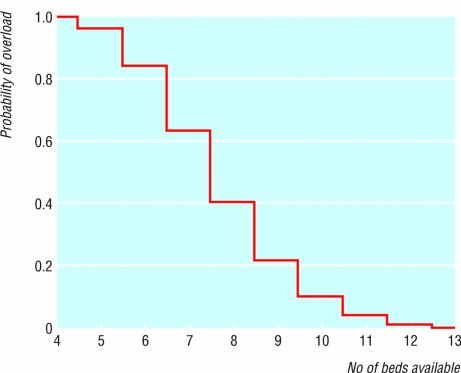
This plot shows the probability of delay for a given number of beds in an experiment by Gallivan, Utley, Treasure, and Valencia in an article in the British Medical Journal
in 2002. This is Figure 3 from that paper. See Reference [2].
References
[1] Analytical Methods for Calculating the Capacity Required to Operate an Effective Booked Admissions Policy for Elective Inpatient Services,
Gallivan, S., Utley, M., Treasure, T. and Valencia, O., Health Care Management Science, Vol. 6, NO.2, 97-104 (2003)
[2] Booked inpatient admissions and hospital capacity: mathematical modelling study,
Gallivan, S., Utley, M., Treasure, T. and Valencia, O., British Medical Journal, Vol.324, N0.7332, 280-282
(2002)