
As part of the second term of STOR-i MRes programme we receive talks on a variety of potential research topics. One such talk, by Dr Juhyun Park from Lancaster University, discussed the use of functional data. In this blog, I will explore one of the examples used in her presentation.
At 193cm I am the tallest member of the STOR-i programme — including both my fellow MRes student and all the PhDs! I was also taller than the vast majority of my peers during my undergraduate studies and the University of Exeter and one of the tallest people in my sixth form.
My parents recorded my height every year as I was growing up, so would it have been possible for my parents to use this information to predict how tall I would be as an adult?
The first thing they might have considered is their own heights. My dad is 182cm and my mum is 168cm. At ten years old I was 149cm so since they were both shorter at that age than I was, they might have (correctly) guessed that I would grow to be taller than both of them. To guess exactly how much taller is where things get more difficult.
If my parents had height data for other children as they grew into adulthood they could made a prediction about my future height by looking at the adult heights of different people that were a similar height at ten years of age. However, children grow at different rates and often two people who are exactly the same height as children may be very different heights as adults. In particular girls and boys tend to grow at different ages. Often girls are taller than boys at about eleven or twelve but do not tend to grow as much during their teenage years.
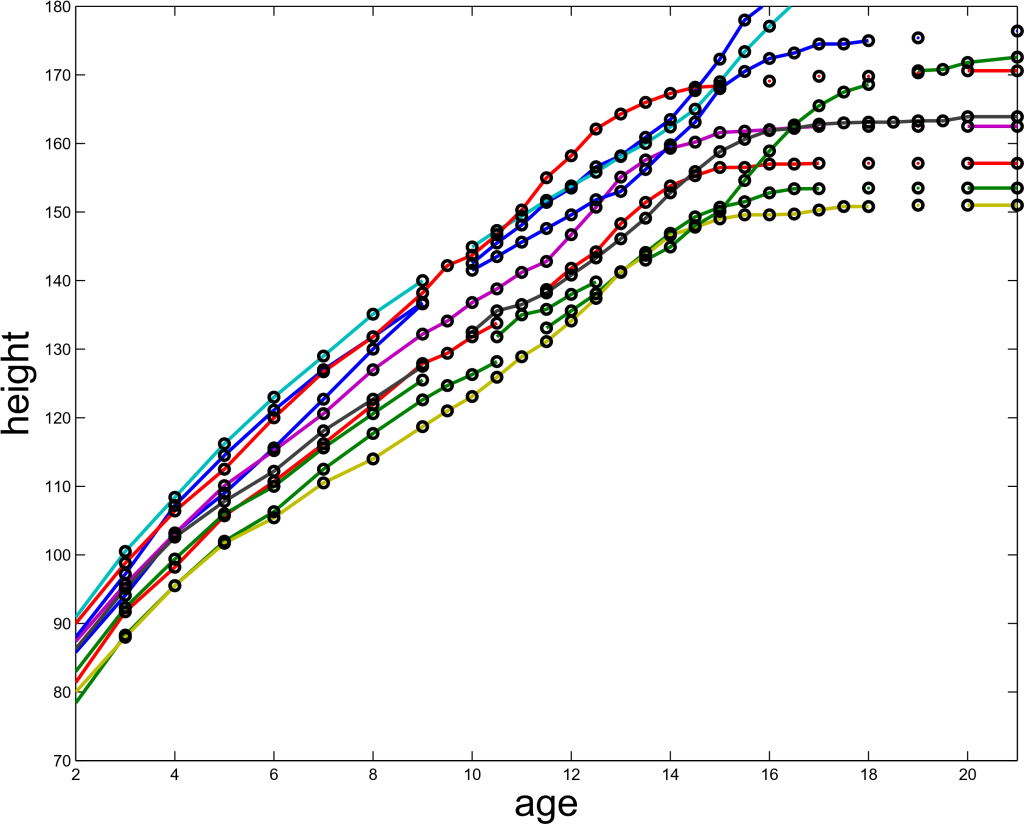
Instead of just considering a child’s height at a fixed time (for example at ten years old) we can instead look at their height each year up to adulthood. Note that although we only have a fixed number of observations we can fit a smooth line through these points to make a continuous function. We can therefore think of a child’s height as a function of time. So, for my height function we have f(10)=149cm and f(23)=193cm.
The figure below, kindly provided by Dr Park, shows the height functions for several individuals:
Since these functions are smooth, we can differentiate them to get a curve for the rate of growth. This is shown in our second figure below (also provided by Dr Park):
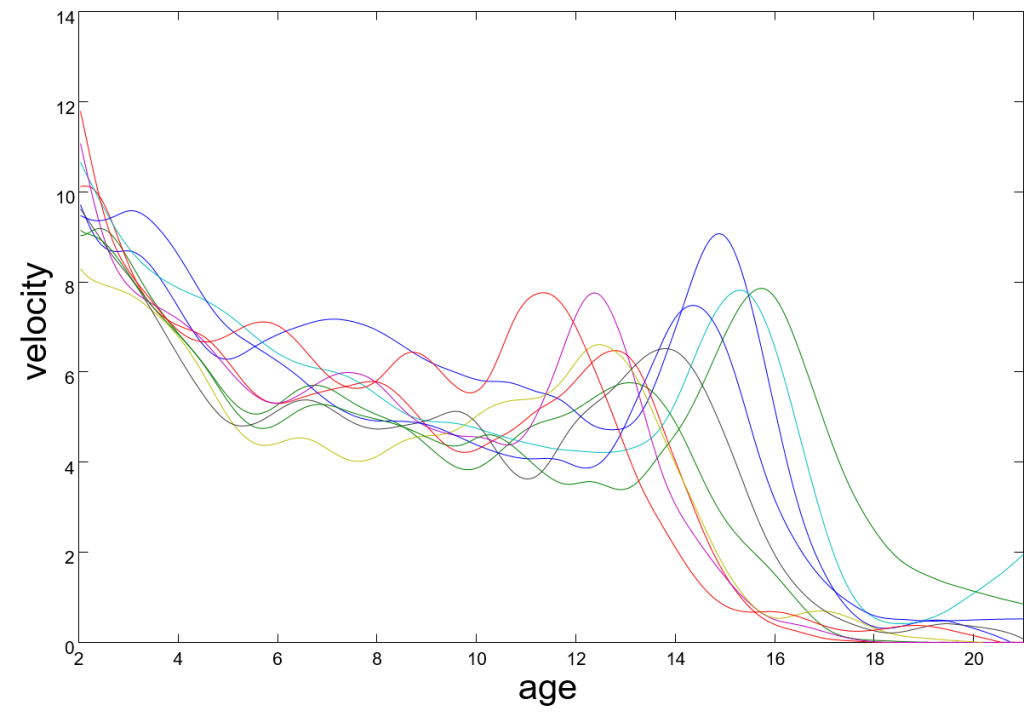
Here we show the child’s rate of growth with velocity in centimeters per year.
Although these functions are all different, we can notice some similarities. In each case, the child grows very quickly when they are very young and then growth gradually slows until they are about six. It then spikes again during puberty which happens once, usually between the age of eleven and seventeen. After this the rate of growth gradually drops to zero. Many of the curves also have several smaller peaks and troughs in various positions.
This leads us to the question: what does a normal growth curve look like?
If we are just looking at height at a particular age we can simply calculate the mean and can even produce some confidence interval for that estimation. But how do we find the mean for a function? A naïve approach would be to calculate a function, such that for any age, the value of the mean function is just the mean of all the functions, evaluated at that age. But since the peaks caused by puberty occur at different ages for different people, averaging in such a way would produce a much wider peak over multiple years that isn’t representative of a realistic growth rate.
What we can do instead is to first find the mean age for puberty (we will call this the structural mean) and scale each of the curves to fit this mean. Dr Park produced a graph that illustrates this step:
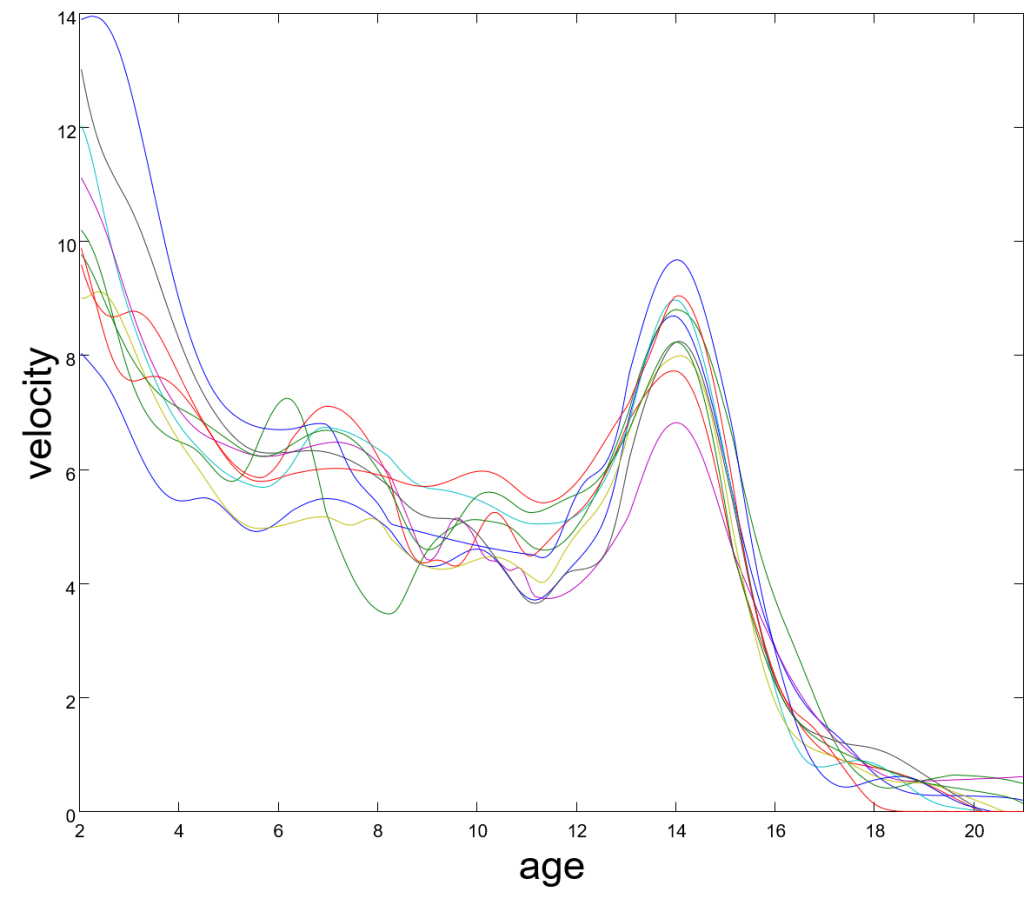
A function that is defined by taking the mean at each point in time of these new curves will now produce a much more realistic mean height function.
So how could my parents have used this to estimate my future height?
As a tall person it is unlikely that my growth curve would be particularly close to the average. This is where we need to consider my recorded heights up to the age of ten as well. Ideally we want the people to which we are comparing my height, to be as similar to me as possible as these people are likely to have a more similarly shaped height function. For example, only considering the average height of boys makes sense. Ideally we would also want to only consider boys whose parents were a similar height to mine and who were also a similar height to me at every age up to ten, although this may not be possible unless we have access to a lot of data.
Since, we only have my height function up to age ten we can then scale this average height function to match my data as closely as possible and then integrate in to find an estimate of my height.