Whether we’re famous statisticians or just regular people, we look towards the majority. We even have terms for this, like groupthink. Traditionally, statisticians take data and focus their analysis on the majority of the data. But what if we didn’t want to look at the majority? What if we wanted to focus on the extremes of a dataset?
Turns out there’s an entire area of statistics dedicated to researching rare occurring events which statisticians aptly named it Extreme Value Theory (EVT). But why would anyone look extreme values? Well, think about rare events like flooding. The picture above (credit to: myself) was taken in York, February 2020, when the River Ouse flooded, disrupting a lot of businesses and causing lots of damage. If you look closely, you can see water coming out of a letterbox, which is not ideal.
River levels fluctuate every day but they don’t flood every day. The majority of the data of river levels show the river levels to be quite low, but extreme cases of river levels causes flooding which is detrimental to people’s lives and livelihoods.
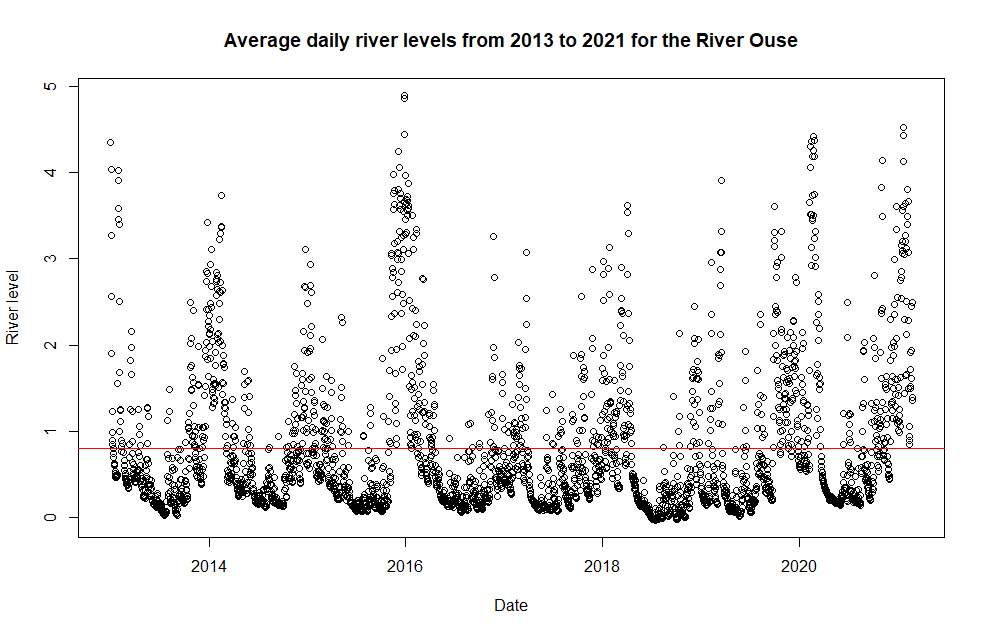
River level data for the River Ouse between January 2013 to February 2021. Each point is the average river level (in metres) for a day. The red line is the mean of the whole data set.
The image above shows a plot of the river levels of the River Ouse across the last 8 years, with each point showing the average river level of a single day. The red line represents the mean (average) river level of the data. The majority of the data, as you can see, lies below 1m. By using the whole data set to calculate the mean, the mean lies drastically lower than the highest river levels, the levels at which flooding occurs. So using this mean estimate on the whole data would be futile when preparing flood defences for future flooding.
This is where Extreme Value Theory comes in.
Distribution of Maxima
A distribution is a mathematical function that describes how data is, well, distributed (or spread). Statisticians love to fit distributions to data, it’s like an addiction. Got some data? Let’s model it with some distribution. This is no different with extremes. We want to model the behaviour of outliers in data, like high river levels. However, high river levels are rare so we don’t have that much data for it. So what should we do? Should we wait? Well ideally not, the pub and shop owners won’t be happy if we wait for 100 years for data before building flood defences to help them.
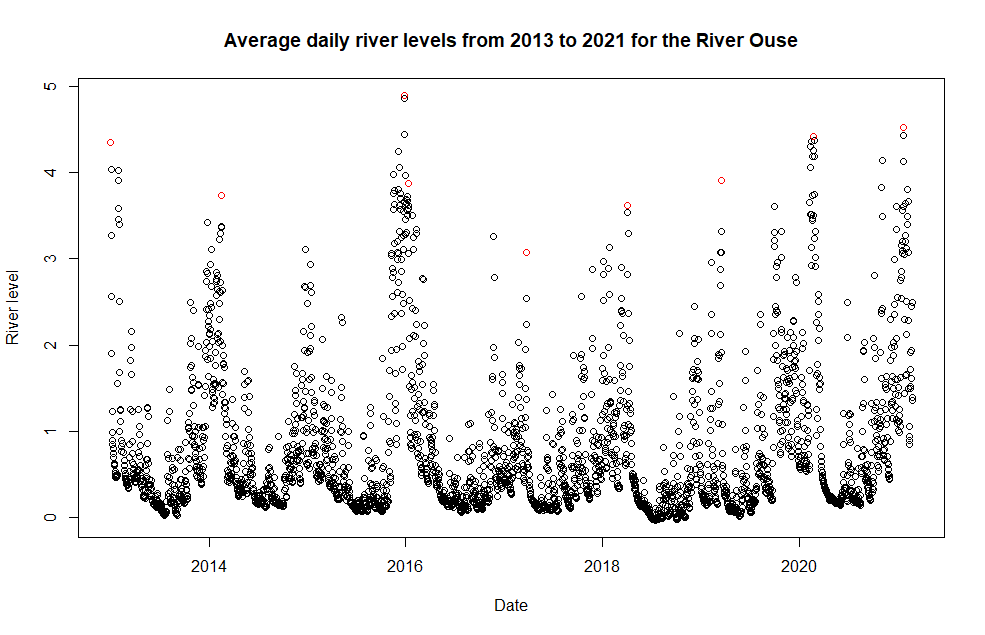
Well we know that flooding occurs at high river levels, so instead of using all river level data, let’s just take the highest values, or the maxima. The image below shows the maximum river level in each year, highlighted in red.
River level data for the River Ouse. The maximum river level in each year from January 2013 to February 2021 are highlighted in red.
As the image shows, there’s only 9 points so that’s very little data. But amazingly, it turns out that by taking the maxima, this new dataset actually follows a distribution! And even more, the Extremal Types Theorem (basically) says:
we get the same distribution for the maximum of a large number of variables whatever their original distribution
So no matter where the data comes from, if we take the maximum values of this data (e.g. the maximum river level for every month) then these maxima will follow the same distribution, specifically the Generalised Extreme Value (GEV) distribution. The distribution needs fine tuning in order to model different data (change the values of some parameters until you get the best fit) but this is great news! It means we can actually describe the behaviour of extreme data which will help when seeing if new high river levels were ‘expected’ and if the flood defences were up to scratch.
Exceedances
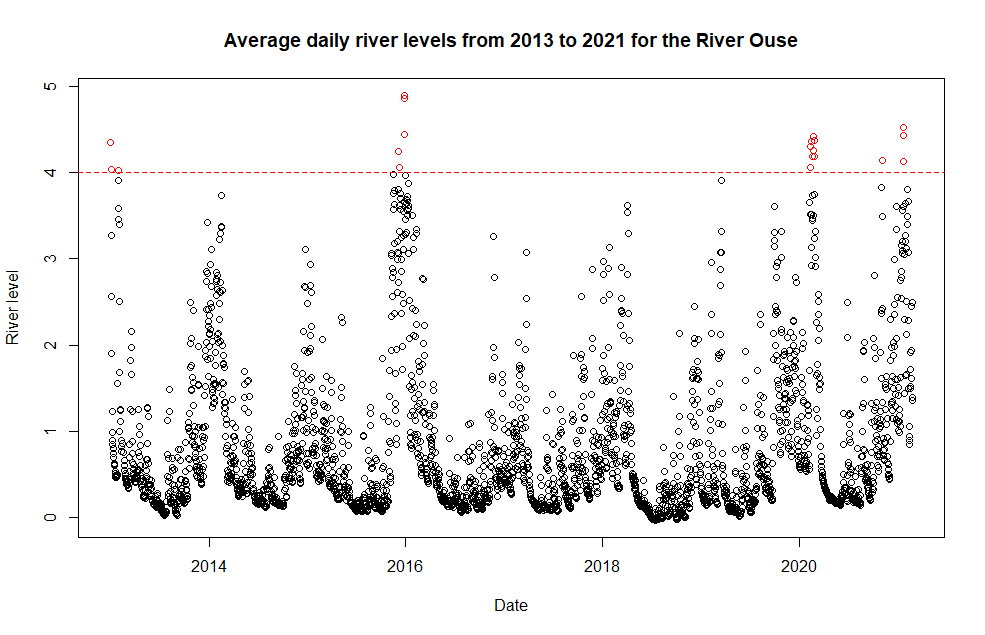
When looking at high river levels, just taking the maximum river of level of each month is problematic however. It can cause lots of uncertainty in the data and we could be potentially throwing away lots of relevant data. If a river floods one day, it could be a while before river levels fall back down again. Therefore, instead of just looking the maximum river level of each month, we consider an exceedance threshold. All data that exceed this threshold are considered extremes. The image below shows an exceedance threshold for the River Ouse data, where all values exceeding this threshold is highlighted in red.
River level data for the River Ouse. The dash line is an exceedance threshold. All points above this threshold is considered an outlier, or extreme. These extreme values are highlighted in red.
Doing this means we are including a lot more data into our results, which is good as that means we have more information. A lot of work has been done on this and it turns out that, given a threshold level, the number of values that exceed this threshold actually follows a Poisson distribution. Moreover, the actual extremes data follows a Generalised Pareto Distribution and from this we can give the probability that data exceeds a threshold.
Further Reading
So we have seen that Extreme Value Theory can be extremely useful, particularly for environmental data like flooding. The data shown in this blog post are what we call univariate, it only focuses on one variable, i.e. river level. We can expand this work by looking at the multivariate setting, looking at many variables like time dependency, for example if river levels yesterday (or in the past week, in the past month etc) affect river levels today. There are lots of exciting work to be done in EVT, and if you would like to read more, follow the links below!