I think it’s safe to say that we’re all dreaming about the possibility of travelling to exotic locations, soaking up some sunshine and forgetting all about meetings on Microsoft Teams. I know I am! But when millions of tourists do return to the skies how are their flights ensured to get to their destination as safely and efficiently as possible? Enter Trajectory Based Operations, a concept developed as a response to rapid growth in the aviation industry. The aim of this blog post is to introduce you to Trajectory Based Operations in Air Traffic Flow Management in a way that doesn’t send you running for the hills. So please stowaway your tray tables, return your seat to its upright position and let’s get started!

First, let’s introduce Trajectory Based Operations. In a nutshell, this concept involves the management of multiple 4D trajectories – we’re talking longitude, latitude, flight level and time – and their interaction in order to create an efficient air traffic network. Also, part of this concept is that we care a lot about what the airlines have to say, so we want to include their preferences and keep the deviation from these to a minimum.
What we’re doing here can be broken down like this:
- Given a set of initial trajectories requested by airlines, knowledge of airspace configuration and capacity restrictions
- We want to find a new set of trajectories
- Such that airport and airspace sector capacity are satisfied and our system is as efficient as possible.
Also – we want to incorporate airline preferences, minimising the deviation from the trajectories the airlines have requested.
So, wherein lies the problem? Well, one thing that really puts a spanner in the works is that airlines don’t like to disclose information about their preferences because it’s part of their confidential business plans. They can just say, “the new trajectory you’ve given us doesn’t match our preferences” without stating why or what their preferences are – not very helpful if you ask me!

One way to tackle this problem is to use a multi-objective optimisation model. The model in mathematical notation looks very complex so I’ve spared you the maths anxiety and the eye sore. We’ll ditch the notation and, instead, put it all together in word form.
Multi-Objective Model
Here, the objective function consists of three minimisation objectives: time deviation from the current schedule, route charges and the cost of deviation from airline preferences. The model seeks to minimise these objectives subject to feasibility, the constraints of the airspace and the priorities of the airlines. Our constraints cover all that stuff that ensures there’s no funny space-time continuum antics. This isn’t Back to the Future. Normal, real-world flying permitted only!
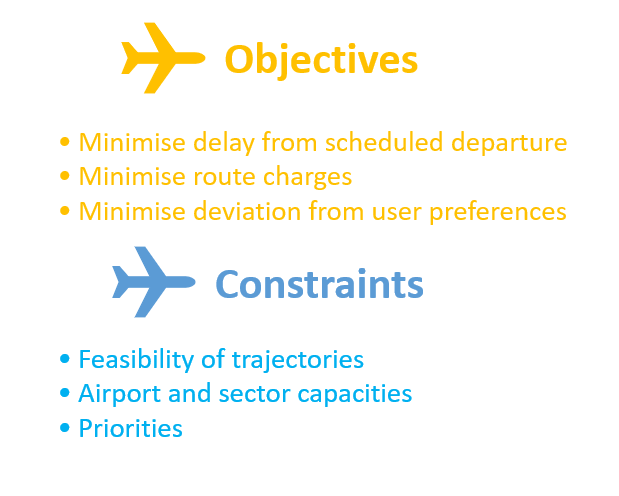
The deviation of user preferences in this context is done by assigning a cost to deviation. These costs are generated to reflect some kind of preference factor, like fuel consumption. The model then seeks to minimise the cost of the difference between the fuel consumption of all the original trajectories and the fuel consumption of the new trajectories assigned to the airlines.
We can then go about solving this model with a swanky simulated annealing algorithm to find our new trajectories. Something to keep in mind is that this will give us a good approximation of the Pareto optimal frontier, so multiple approximately optimal solutions. Each will benefit airlines differently, so choosing just one is a challenge in itself! Making this decision is at the forefront of the future research to be conducted in this area – how exciting!
Another approach is to try and extrapolate information about preferences by performing clustering on historical trajectory data (to get a general gist of clustering, you can check out another one of my blog posts here). By doing this, we want to sneakily find out why some trajectories are preferred over others.
Data-driven Approach
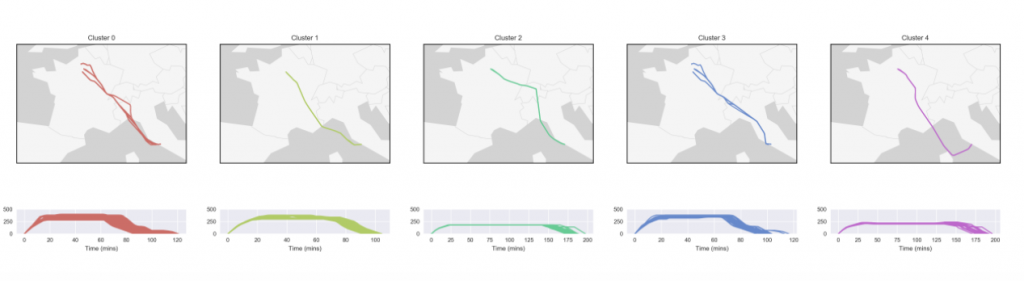
The main crux of this approach is to use a density-based clustering algorithm on historical data to obtain similar trajectory clusters. Below, we can see this applied to the European airspace, considering flights from Rome to Paris. In this example, five clusters were found.
Once the clusters are found, a decision tree is created. Here, the nodes represent conditions based on flight characteristics e.g. whether the flight is a morning flight or whether the flight uses a specific aircraft model. We then compute for each terminal node, the percentage of flights reaching a terminal nodes from each cluster. Take a look below to see what I mean.
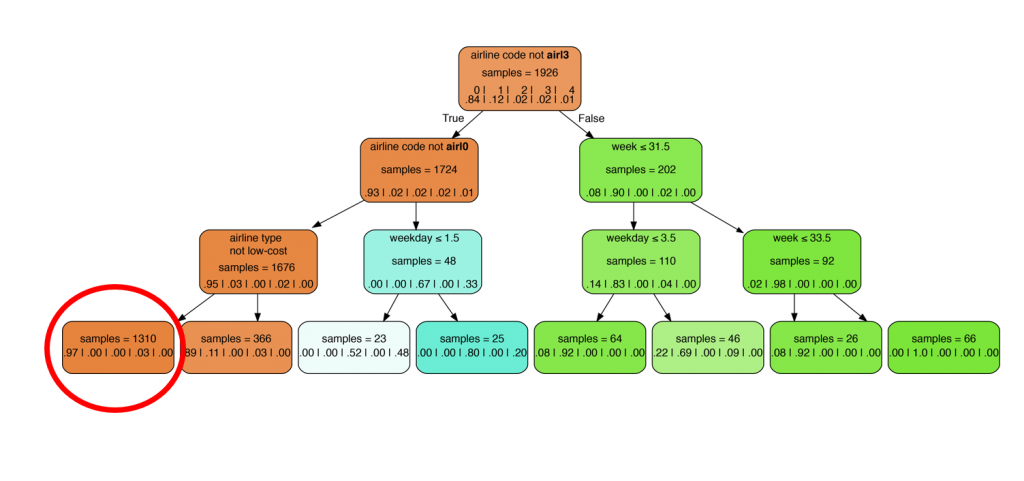
The left-most terminal node states that 1310 flights do not have airline code airI3, nor airline code airI0 and do not belong to an airline of low-cost. We also have that 97% of the time a flight with these characteristics flies a trajectory belonging to the first cluster and only 3% of the time does this kind of flight fly a trajectory belonging to the fourth cluster. The percentage of flights with these attributes flying a trajectory in the second, third and fifth cluster is 0%. These results are interpreted as a preference level, so that a flight with these features (not airline code airI3, not airline code airI0 and do not belong to an airline of low-cost) is said to have a preference level of 97% for a trajectory belonging to the first cluster. This analysis is performed for all terminal nodes of the tree!
These results can then be fed into optimization models that seek to incorporate airline preferences by providing information about preference levels. In particular, feeding models that, for each flight, consist of selecting a trajectory chosen from a set of feasible alternative trajectories!

So, if you’re lucky enough to be sipping a G+T 30,000ft in the air anytime in the near future, you know a little bit about the methods that got you there! If you’re daring enough to brave the mathematical notation, make sure you check out the original papers in the ‘Want to know more?‘ section below. All that good stuff is in there!
Just got time for my tweet of the week! This weeks’ goes to Shanice E. W. Janssens. Shanice, I feel so seen.
Missed my last post? Check it out here.
Want to know more?
Lancia, C., De Giovanni, L. and Lulli, G. [2019], Data analytics for trajectory selection and
preference-model extrapolation in the european airspace, in ‘Operations Research Proceedings
2018’, Springer, pp. 563–570.
Dal Sasso, V., Fomeni, F. D., Lulli, G. and Zografos, K. G. [2019], ‘Planning efficient
4d trajectories in air traffic flow management.’, European Journal of Operational Research
276(2), 676–687.