
What to do with missing data?
In this post I’m going to describe some simple ways of dealing with missing data and discuss some of their strengths and flaws.
How methods to deal with missing data will depend on the Missingness Mechanism that informs the missingness pattern. I describe Missingness Mechanisms in my previous post, which you can find here. If you haven’t read that, you may want to take a look before continuing with this post.
There are four techniques I’m going to describe: Complete Case Analysis, Unconditional Mean Imputation, Regression Imputation and Stochastic Regression Imputation.
I am going to illustrate these methods with an example. Imagine we are interested in racehorse performance and we conduct a survey of racehorse heights and weights. Unfortunately, some of the weight data has gone missing.
I wrote about Missing Data for a second, longer research report at STOR-i (I mentioned the shorter first report in this post). I created the images below from a simulation study that I carried out for this report (where I followed the racehorse example described above). I will post the link to the full report at the end of this blog.
Complete Case Analysis
One of the simplest ways of dealing with missing data is Complete Case Analysis. This means that we delete any responses that have any missing data in them. This method is okay if we have data that is Missing Completely at Random or if we do not have a lot of missing data. But, if we do not have these — nice — conditions then we can introduce bias into the dataset.
For example, if tall horses do not like being weighed (perhaps the weigh bridge is claustrophobic), then if you delete all cases where weights are missing you will probably be looking at a sample with lower heights and weights than is representative of the population.
So, if you don’t use Complete Case Analysis there are still some fairly simple options open to you. These next three methods involve forms of something known as imputation.
Imputation? What is that?
The next method is the first I introduce where you impute data — this means you replace missing values with estimated values.
This may seem strange at first — isn’t this just making up values? How could this make your analysis better?
Well, imputation can help you avoid the pitfalls that simply deleting missing data could land you in.
However, you will (I hope) see that how you decide to impute the missing data can drastically affect the rigour of your analysis.
Unconditional Mean Imputation
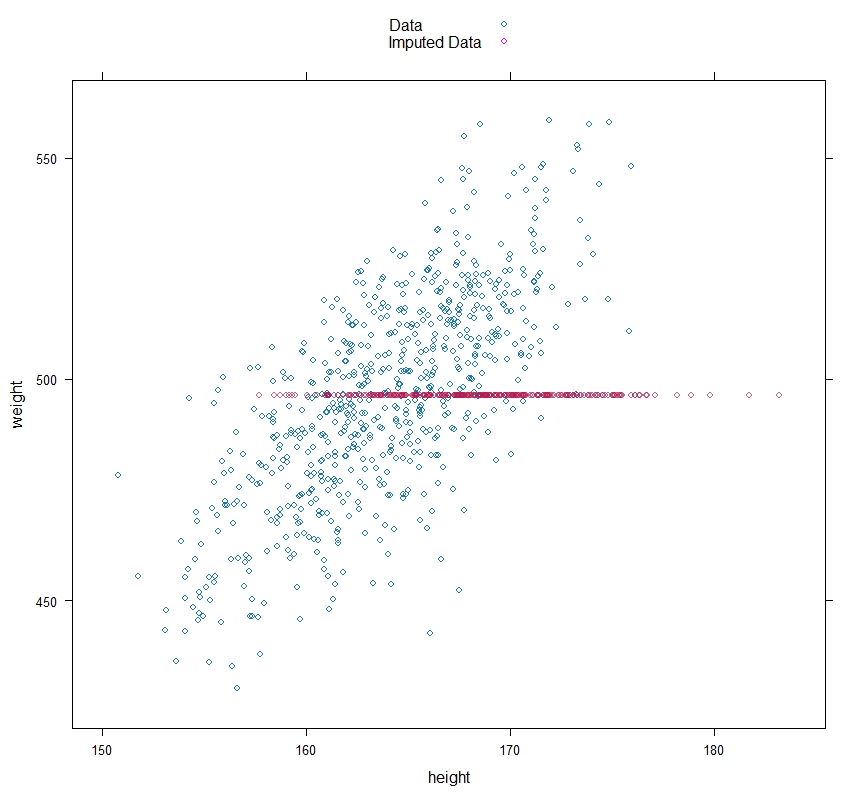
The first method I am going to describe is the simplest: Unconditional Mean Imputation. You take the mean of your observed data and impute any missing values with it. So, if we have missing racehorse weights, we fill in missing weight values with the average of those that we do observe.
This, you can probably imagine, can be problematic, too. If we look at the below plot, where I’ve imputed data that is simulated from the above situation — where taller horses are more reluctant to be weighed — we can see that the imputation will underestimate the true mean and the variation in the data.
Regression Imputation
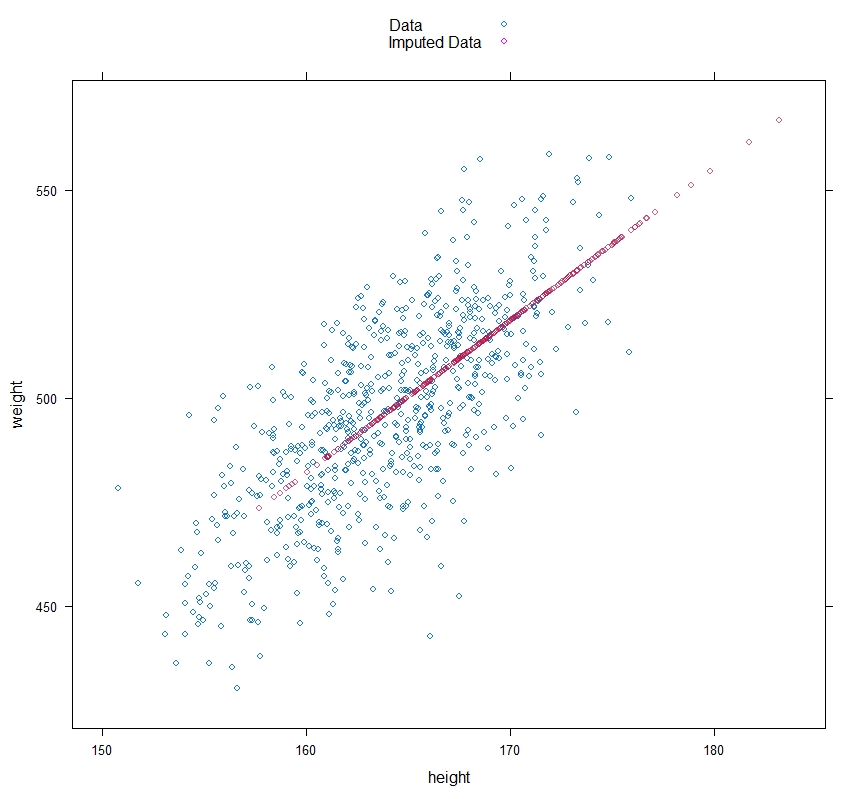
Regression Imputation is a little better as in the situation we are considering it should help to eliminate some of the bias that Unconditional Mean Imputation brings.
This works by drawing a regression line, based on the complete observations that you have, and using that to predict where a piece of missing data will fall on the regression line.
The method works better in terms of bias, but it still underestimates the variation in the data — as we can see in the figure.
To deal with that we have our final method, Stochastic Regression Imputation.
Stochastic Regression Imputation
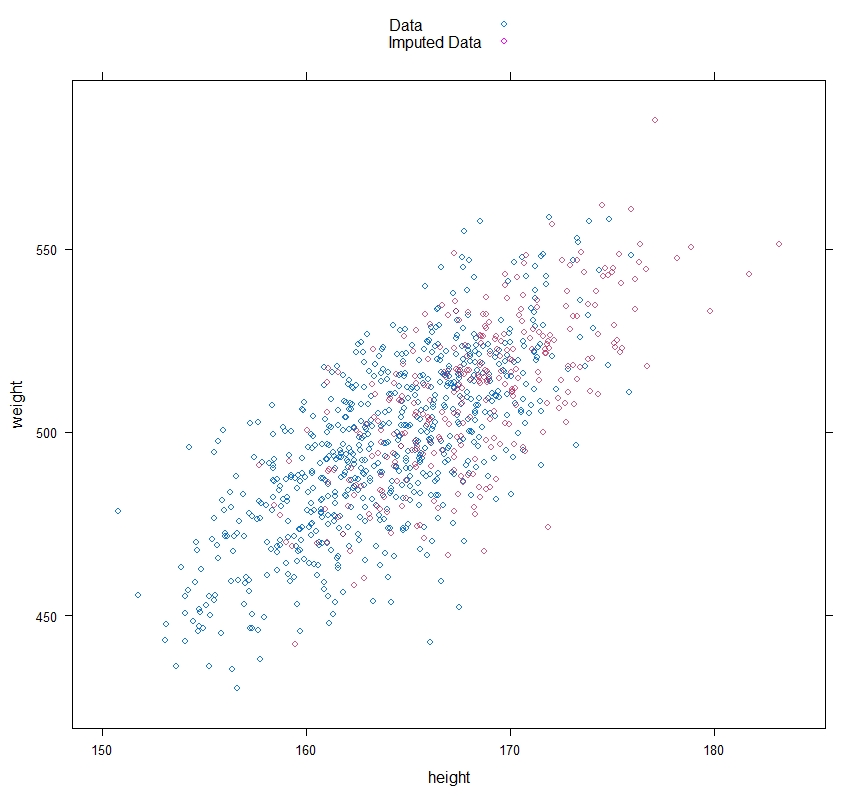
This methods works in a similar way to Regression Imputation — but it adds a random element so, instead of points being interpolated directly onto the regression line, they are scattered about it in a random fashion.
As we can see in the plot, this shows a much more realistic representation of the variation in the data.
You may be thinking that introducing values yourself to replace missing ones will cause its own problems.
Read my next post to find out how to account for the uncertainty that you are introducing through imputing missing data.
Want to know more?
You can read more about Complete Case Analysis (and some variations/adaptations of it) in Chapter 3 of the below book. The Single Imputation Methods I’ve described are discussed in Chapter 4.
Little, R. J. A. and Rubin, D. B. (2020). Statistical analysis with missing data. Wiley Series in Probability and Statistics. Wiley, Hoboken, NJ, third edition.
Another single imputation method that I do not discuss here (but I do in my report) is Hot Deck. You can read about it in this paper:
Andridge, R. R. and Little, R. J. (2010). A review of hot deck imputation for survey non-response. International Statistical Review, 78(1):40-64.
I used the R Package mice to do my analysis. You can read about it in this paper:
van Buuren, S. and Groothuis-Oudshoorn, K. (2011). mice: Multivariate imputation by chained equations in R. Journal of Statistical Software, 45(3):1-67.
Thank you for reading! Click here to go to the next post on Missing Data.
Click here to see my first post on Missing Data: on the different types of missingness.
You can see my full report for STOR-i on Missing Data, here.


2 Comments
Pingback:
Pingback: