Troubled Geographies:
A Spatial History of Religion
and Society in Ireland
|
|
Troubled Geographies:
|
|
| Full text available from Indiana University Press | |||||||||||||||||||||||||||||||||||||||||||||||||||||||||||||||||||||||||||||||||||
|---|---|---|---|---|---|---|---|---|---|---|---|---|---|---|---|---|---|---|---|---|---|---|---|---|---|---|---|---|---|---|---|---|---|---|---|---|---|---|---|---|---|---|---|---|---|---|---|---|---|---|---|---|---|---|---|---|---|---|---|---|---|---|---|---|---|---|---|---|---|---|---|---|---|---|---|---|---|---|---|---|---|---|---|
6. Partition and Civil War, 1911-26
Division has emerged as the primary motif of Irish society at the beginning of the twentieth century but, as this chapter will identify, this is rather more nuanced than the rupture between green and orange. This chapter explores the degree to which the old religious centrality of modern Irish history not only held firm in this period, but came to consolidate its position to such an extent that it led directly to the territorial division of the island. PopulationThe period between the censuses of 1911 and 1926 was the last in which the population of the island of Ireland would decline. Thereafter, the population of the island would increase throughout the rest of the first half of the twentieth century. By 1926, however, the island was politically divided between the newly-created Northern Ireland and Saorstát Éireann or Irish Free State and their differing population trajectories, which had been apparent since the 1891 census, would now be increasingly clear.
Figure 6.2 shows population density at rural and urban district level across the island in 1911 and 1926. There is little discernable difference between the two dates according to these maps and it is only by comparing the populations directly at district level for each date that we can gauge population trends during this period at the local scale. Fig 6.3: Percentage population change at rural and urban district level between 1911 and 1926. Figure 6.3 shows that in comparison to the radical falls experienced in earlier periods, fairly broad tracts of the island remained reasonably stable in population terms in the years between 1911 and 1926. The west coast continued to experience population decline, with the largest contiguous area of loss being in the north-west, centred on County Sligo. The map reflects the growth of the population around Dublin and Belfast, but other urban centres such as Cork and Limerick have not grown significantly during the period. The map also suggests pockets of substantial rural growth, for example in County Roscommon in the mid-west of Ireland. This is misleading, the supposed growth is actually the product of districts being aggregated together between the two dates,in every case where the map seems to show an increase in the population in rural districts isolated from the major cities this is actually a product of boundary change reflecting continuing population decline. Thus there is an ongoing pattern of urban growth and rural decline. PoliticsIreland changed more during the short period between 1911 and 1926 than at any other time during the past two centuries. This section provides the political context to the social and religious developments which this chapter identifies.
Fig 6.4: Results of the December 1910 Westminster elections. Cork City and the University of Dublin were both two-seat constituencies in 1910, Nationalists won both seats in Cork City, Unionists both seats in the University of Dublin. Figure 6.4 shows the results of the December 1910 general election. It shows that the country was already clearly divided between a nationalist south, which returned candidates supporting Home Rule, and a unionist north, with a dominant political culture sworn to maintaining the link with Britain. The greatest political ironies in this period lie in an examination of the notion of loyalty. For the vast majority of nationalists, agitation for Home Rule was not a halfway-house to full independence for which there was little appetite. Instead it was the recognition that Ireland should be allowed to take its rightful place alongside the other member nations of the British Commonwealth.
Fig 6.5: Results of the 1918 Westminster elections. Cork City was a two-seat constituency in 1918, Nationalists won both seats. The Easter Rising of 1916 took most people by surprise and the republicans who had seized control of the General Post Office and other key buildings in the capital were defeated and rounded up within a matter of days. Initial public reaction to the Rising was, in general, hostile however, the ill-judged British response made it a symbolic victory of huge proportions. The execution of fifteen of the ringleaders, including Connolly and Patrick Pearse, marked the start of a change in public opinion. During the years after the Rising the more militant Sinn Féin completely supplanted the home rule parties as nationalist aspirations moved from limited self-determination to full independence. This is clear from the election results for 1918, shown in figure 6.5, which show that Sinn Féin won almost every seat in the twenty-six county area.
Fig 6.6: Results of the 1921 Northern Ireland and Southern Ireland elections. Circle size is proportional to the number of seats. In 1919 hostilities between the Irish Republican Army (I.R.A.) and British forces led to the introduction of the Government of Ireland Act of 1920 which brought Home Rule into force with separate parliaments in Belfast and Dublin.The results of the subsequent elections to both parliaments in 1921 are shown in figure 6.6 which shows again that in the southern twenty-six counties Sinn Féin won almost every seat. The six counties that were to become Northern Ireland were dominated by unionists, however, away from the north-east Sinn Féin and other nationalists were elected, reflecting the substantial Catholic populations in these areas.
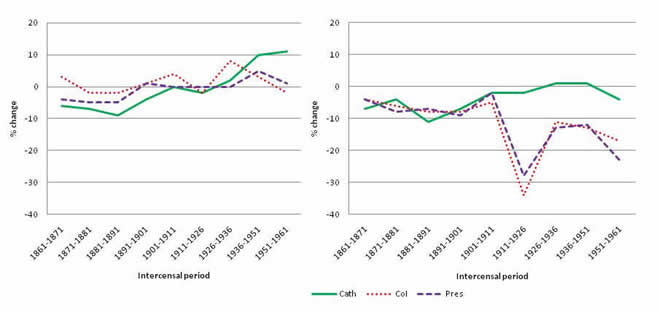
Fig 6.7: Results of the 1922 Northern Ireland and Saorstát Éireann elections. The Government of Ireland Act was ignored by Sínn Féin, who by now had their own shadow administrative and legal structures in place and were operating as the de facto government of Ireland. The conflict progressed with increasing bitterness as regular British troops were reinforced by the ill-disciplined ‘Black and Tans’ until a truce was finally called in July 1921. Protracted negotiations led to the signing of the Anglo-Irish Treaty in December. The Treaty split nationalist Ireland, not primarily because it conceded the exclusion of the six counties of Northern Ireland, but because of the oath of allegiance to the British monarch and the failure to deliver a full Irish Republic. The treaty was ratified by the Dáil and had the clear support of the majority of people in the twenty-six counties, although opposition was particularly strong in the south-west of the country as indicated in figure 6.7. This was the area which would see the most intense fighting of the Civil War and some of its worst atrocities such as the Ballyseedy massacre in which nine anti-Treaty ‘die hards’ were tied to a landmine which was then detonated. ReligionFig 6.8: Inter-censal percentage change in three major religions between 1861 and 1961 in (a) the Northern Ireland area and (b) the Republic of Ireland area. Cath: Catholics, CoI: Church of Ireland, Pres: Presbyterians. Figure 6.8 shows that in the period before1911 Ireland’s three main religions broadly display similar demographic patters. Figure 6.8a shows that each of the three religions experienced population decline after the Famine, with Catholics faring slightly worse and taking longer to recover from its effects. This observation ties in with the last chapter’s observations on the disproportionately severe impact of the Famine in Catholic areas of Ulster. Figure 6.8b shows a similar pattern of decline among Catholics, Presbyterians and members of the Church of Ireland prior to 1911. However, between 1911 and 1926 the situation changed dramatically as the two major Protestant denominations both experienced massive levels of decline in what became the Free State. During this time the Church of Ireland population fell by nearly 35 percent while the number of Presbyterians fell by 27 percent.
Figure 6.9 maps the main religious divide in 1911 and 1926. It dramatically reflects the shifts in the religious populations that occurred as a result of the upheavals as the two states moved towards partition. There is a sharp contraction in the areas in which there are significant Non-Catholic populations between 1911 and 1926, particularly in the midlands and County Cork. Very few districts in the south saw growth in the Non-Catholic population in this period, but two that did were Castletown in the extreme south-west and the town of Buncrana in County Donegal. Continuing the military connection, the likely reason for the fact that they contained 'treaty ports', naval bases which remained under British control as part of the peace settlement.
From what has already been established about the historical distributions of the major Protestant denominations, and what figure 6.10a confirm is that it was the Church of Ireland population who withdrew from these areas as their populations decline dramatically across many areas south of the border.
Figure 6.10b shows that the Presbyterian population was located predominantly in the extreme north-east of Ulster with tiny minority populations in those Ulster counties excluded from the newly-created Northern Ireland. While in relative terms the maps below show that the Presbyterian loss of population in the Republic of Ireland area was comparable to that suffered by the Church of Ireland, in reality they were a much smaller population. ConclusionsThis chapter has dealt with the historical and spatial dynamics of partition as well as its practical application. Partition was the ultimate expression of Ireland’s division, but it did not resolve the class division which had also become apparent between 1911 and 1926. Rather it served to underline the divisions between northern and southern unionism and exacerbated the ideological cleavage which the Treaty settlement had created in Irish nationalism. Nor did it ultimately resolve the core constitutional issues it was designed to address but rather left Catholics feeling resentful, and Protestants in the north insecure and in the south, isolated. Partition was the perfect metaphor for the ideological intolerance which had infected both parts of the island. |
|||||||||||||||||||||||||||||||||||||||||||||||||||||||||||||||||||||||||||||||||||
|
|
|
|
|
©Ian Gregory & Niall Cunningham, 2013