In order to demonstrate the potentials of integrating tools and methods from GIS, Corpus Linguistics and NLP, we recently completed a case study using named-entity recognition in tandem with collocation and spatial analysis to examine the annual Reports of the General Register Office for England and Wales (hereafter, GRO) between 1840 and 1880.
Taken together, the forty volumes surveyed in this study consist of well-over 10,000 pages—far more than would be practical for an individual researcher to read. Our working premise was that GIS could be productively combined with automated corpus analysis techniques to provide researchers with a more efficient way to explore a resource of this size and to devise questions around which to structure their reading.
In this instance we used the Spatial Humanities: Place-name Proximity Search tool (SHPPS) in combination with the Edinburgh Geoparser and the Corpus Query Processor to scan through all forty volumes and identify every instance in which a place name in the corpus appeared alongside (or, in other words, collocated with) the words ‘Cholera’, ‘Diarrhoea’ or ‘Dysentery’ (hereafter, ChDiDy).* This enabled us to create a geo-referenced database, which we then used to study the spatial patterns underlying the GRO’s reporting of these diseases.
*These words were selected because the early reports of the GRO list cholera, dysentery and diarrhoea together. For a full description of this study, and the methods employed, see Murrieta-Flores, et al. 2013.
 This series of maps displays the distribution and frequency of place name-ChDiDy collocates in the corpus by decade.
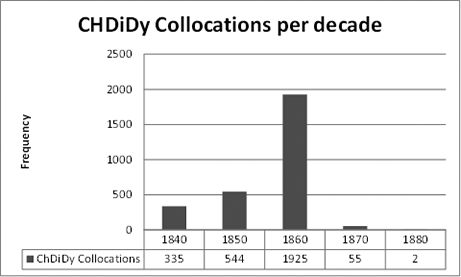
Initially, we set out to identify those places that were most frequently collocated with ChDiDy in the GRO’s reports. Creating a series of maps representing the collocates for each decade helped us to distinguish that these places mainly included major urban areas and ports–including London, Liverpool and Newcastle.
These findings were then tested and confirmed through statistical analysis, which also revealed that the number of place name-ChDiDy collocations increased gradually between 1840 and 1850 and then considerably between 1850 and 1860, after which time they dropped off sharply.
Intriguingly, when we plotted the number of deaths that the GRO’s reports attributed to these three diseases, we perceived a similar trend.
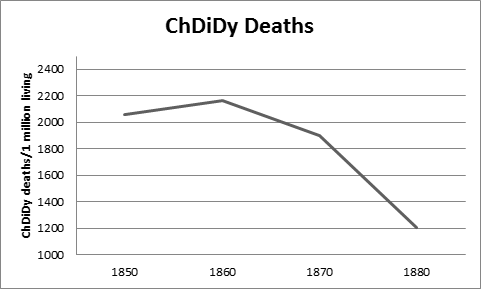
This similarity, of course, does not necessarily indicate an actual correlation between the number of deaths and the number of place name-ChDiDy collocates in the GRO’s reports, but it does suggest that there may have been some relationship between the two.
In order to investigate whether or not this was the case, we created a graph displaying the number of place name-ChDiDy collocations in the GRO for each year. Doing this helped us discern four significant peaks in the number of collocations in the years 1849, 1854, 1866 and 1868.
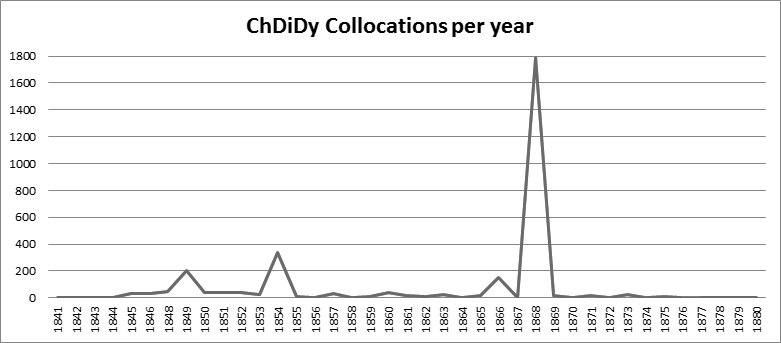
Significantly, three of these four peaks (1849, 1854 and 1866) correspond to the dates major cholera epidemics in Britain that, taken together, claimed nearly 125,000 lives. This gives us sufficient ground to infer that the peaks in place name-ChDiDy collocations for 1849, ’54 and ’66 relate to the high number of deaths that the GRO reported as having been caused by cholera, dysentery and diarrhoea in these years.
Intriguingly, however, the largest peak (in 1868) does not correspond directly to a cholera outbreak in the UK; but is instead a product of an interesting chapter in the history of the GRO. For it was in this year that the GRO published William Farr’s ‘Report on the Cholera Epidemic of 1866 in England’ as an appendix to its 29th volume. This special report, with its detailed discussion of the causes and transmission of cholera, is what caused the peak observed in the graph above.
The key point here is that the peak in the number of place name-ChDiDy collocations for 1868 correlates not to an actual outbreak of cholera in Britain, but to the publication of research into the cause and transmission of the disease–research that, at the time, was pivotal in helping prevent another epidemic from spreading in the UK.
The progress made in preventing the spread of cholera (especially thanks to the pioneering research of the English physician John Snow) is reflected in the charts above, which show that the number of deaths reported as having been caused by cholera, dysentery and diarrhoea decreased sharply after 1866.
It is also reflected in our maps, which demonstrate that after 1866 the major clusters of place name-ChDiDy collocations changes. Whereas London is the location around which the greatest number of the collocations occur in the GRO reports during the 1840s, ’50s and ’60s, during the 1870s it is Newcastle.
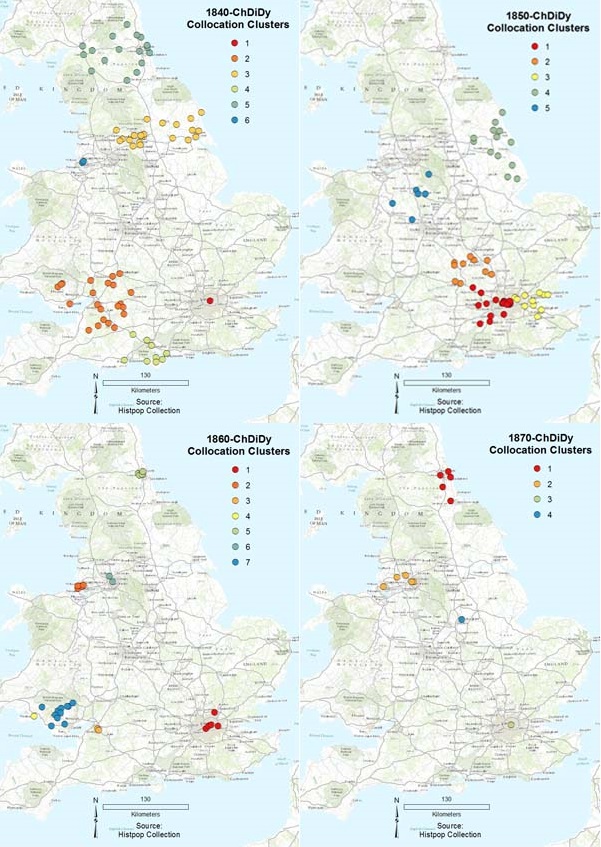 This series of maps shows major clusters of place name-ChDiDy collocations in the corpus by decade.

© Spatial Humanities: Texts, GIS & Places