
Reliability Analysis is an advanced multidisciplinary science stream, which helps to predict and improve the availability and performance of Machines. It uses the concepts of Modern Statistics, Industrial Engineering, and Management Science (Operational Research).
It may be easy to model the univariate reliability function for the non-repairable machines having only one component with the desired amount of accuracy. A univariate reliability function defined as the probability of a machine working until a specified amount of time, without failure. However, In most real-life applications, machines are repairable and have many components. Also, the reliability function is multivariate (depends on some other factors in addition to the time).
In many scenarios, it is essential to estimate the reliability function of a machine for the purpose of warranty price prediction, especially for a manufacturer/ seller (in case of used tools). Furthermore, many project managers/ customers want to know the reliability of devices for a better evaluation of cost for their upcoming project.
Techniques Required for Reliability Function Estimation,
I] Weibull Distribution – For reliability function estimation of non-repairable machines.
II] Bathtub curve – It is a fundamental design to model any hazard function. It consists of three parts called infant mortality, constant failure rate and wear-out failures.
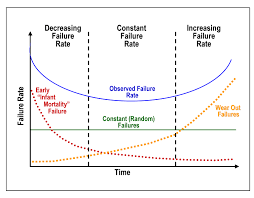
III] Spline Regression/ Piecewise statistical Models – It is in use to model three parts of the bathtub curve with three different models.
IV] Multivariate Statistics – Require to model hazard function, if reliability is depending on more than one factor. As an illustration, the reliability function of a printing machine depends on the time since purchase as well as the number of printed pages.
V] Simulation – Some Reliability Analyst uses it for verification of the result. Also, it is in use to transform the multivariate hazard function to univariate hazard function.
VI] Non-Homogeneous Poisson Process – It is beneficial for the repairable models.
VII] CROW-AMSAA Plot – It is used for repairable model iff the data consists of at least 4-5 repairs.
VIII] Machine Learning – The classification/ clustering algorithm is very useful to predict the name of the component, which may fail in a complex machine.
IX] Neural Network – Some Engineers prefer to use Neural Network/ Deep Learning algorithms instead of Machine Learning Algorithm.
X] Bayesian Statistics – The manufacturer uses some continual improvement techniques to enhance the reliability of a machine. Therefore, any time in the future, the historical data does not give the exact reflection of the reliability function. In these scenarios, professionals use Bayesian statistics for getting a better estimate of the reliability function.
After knowing the reliability function of a machine, every manufacturer/ seller want to know that how to improve the reliability of the existing system. Usually, they find the name of the parts, which are most vulnerable by using Pareto plot. Then they use the improvement tools.
Tools Required to Improve the Reliability of a Machine
Further Reading
Kapur, K. and Pecht, M. (2014). Reliability engineering. Hoboken, New Jersey: John Wiley & Sons.