In my previous blog post, I discussed how we can identify a modular structure within the brain using the Hierarchical Spectral Merger (HSM) algorithm. In this post, we present an application of the HSM method to genuine EEG data recorded during an epileptic seizure.
EEG Data
The data used throughout this post consists of EEG recordings at 21 channels. 19 channels are from electrodes placed on the scalp, and the remaining two (denoted SP1 and SP2 in Figure 3) are from intercranial channels. The recording lasted for 500 seconds, with the seizure known to have started at time point 340 seconds. It is also known that the seizure originated in the left temporal region of the brain, where channel T3 was located.
The EEG recording was split into 10-second non-overlapping intervals, so that the HSM algorithm could be applied to each interval. Results are presented for segments 7 (before seizure), 38 (during seizure) and 50 (end/after seizure) corresponding to time intervals (60 to 70 seconds), (370 to 380 seconds) and (490 to 500 seconds) respectively, with the intention of analysing what effect (if any) different seizure phases had on the clustering results. A trace plot of the EEG signal for channel T3 is presented in figure 1, alongside the estimated spectra for the chosen time intervals.

Applying the HSM Method
The main intention of this application is to analyse how spectral synchronicity with channel T3 varies during the seizure. More specifically, we aim to answer the following question: Which channels are spectrally synchronised with T3, and does this change during different phases of the seizure?
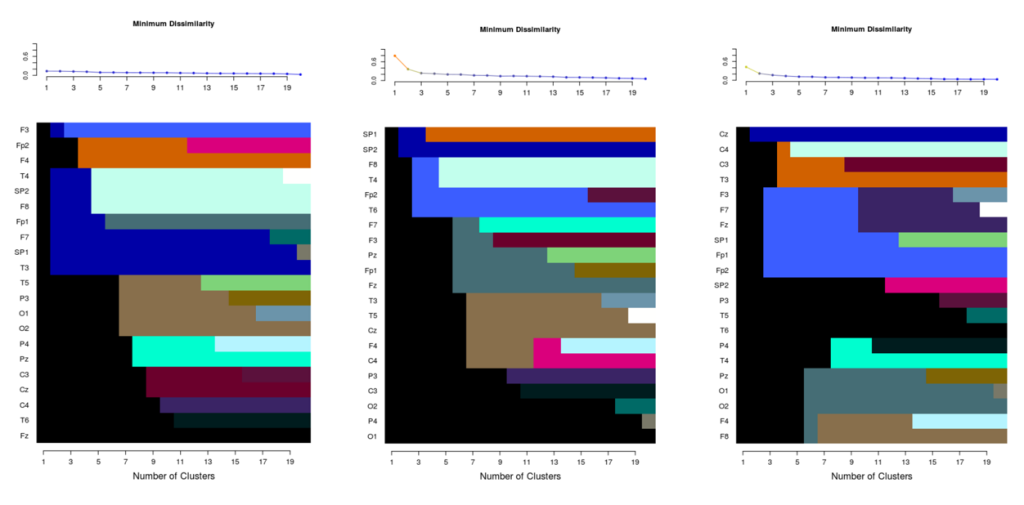
Figure 2 facilitates clustering visualisation for the HSM algorithm. A minimum dissimilarity plot is provided for each time segment, which depicts an empirical criterion used to select the number of clusters (for more information regarding this criterion, see the references below). Using this criterion, the selected number of clusters to be used in the HSM algorithm are 5, 3 and 4 for each of the discussed time segments.

The plots below the scree plots provide details of the clustered channels. By row we have the channel names and by column the number of clusters. In this plot, channels of the same colour are spectrally synchronised, and hence clustered together. Table 1 lists the clusters of EEG channels at each seizure phase as indicated by the plots in Figure 2.

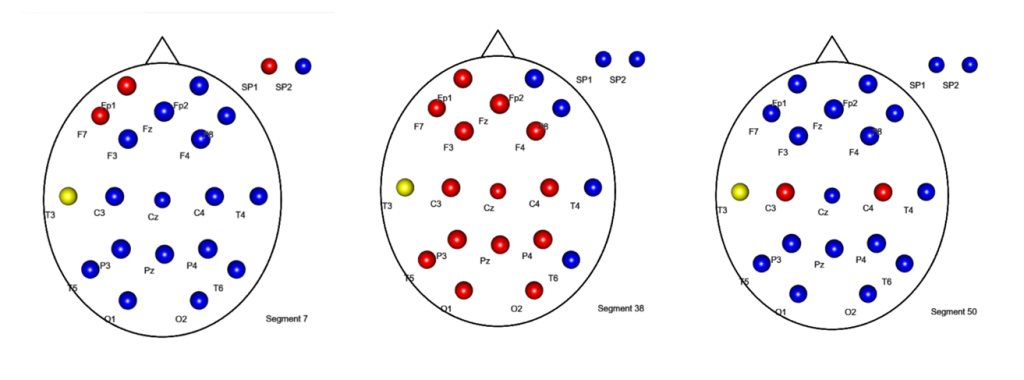
Figure 3 visually depicts the EEG channels located on the scalp, with those in red representing channels which are spectrally synchronised with T3. All other channels are shown in blue, regardless of which cluster they belong to. Prior to the epileptic seizure, only 3 channels were spectrally synchronised with T3, namely F7, F p1 and SP1. Perhaps this makes sense, since these channels are in close proximity to T3 on the scalp.

However, as the seizure progresses, it becomes more likely for channels to be in the same cluster as T3,as shown in the middle plot of figure 3. Here, 14 channels are spectrally synchronised with T3. Finally, towards the end of the seizure when the subject is close to resting state, only two channels (C3 and C4) are spectrally synchronised with T3. Interestingly, these do not coincide with those which were spectrally synchronised pre-seizure. Furthermore, channel C4 is located on the right side of the brain (i.e. opposite side to T3). Our analysis therefore indicates that the right side of the brain was modified by the epileptic episode. Confirmation of this hypothesis would require further investigation on other subjects. Overall, we conclude that the modular structure of the brain does in fact differ depending on the seizure phase.
Further Reading
This blog post has presented an application of the HSM algorithm to genuine EEG data recorded during an epileptic seizure. We note that the graphical aids presented here were obtained using an RStudio Shiny app available at https://carolinaeuan.shinyapps.io/hcc-vis/.
The following references are given as additional material to the interested reader
Chapter 20 of the Handbook of Neuroimaging Data analysis – Hernando Ombao, Martin Lindquist, Wesley Thompson, John Aston
The Hierarchical Spectral Merger algorithm: A New Time Series Clustering Procedure – Carolina Euan, Hernando Ombao , Joaquın Ortega
Spectral synchronicity in brain signals – Carolina Euan, Hernando Ombao , Joaquın Ortega