Let’s pretend we have collected some data. It’s from two separate groups but is measuring the same thing. We draw some conclusions on the data as a whole but then decide to look at the individual groups. From this we find when looking individually, we draw the exact opposite conclusions for both the groups. Seems weird, right? Surely that can’t happen! Well it can and this is known as Simpson’s paradox.
Simpson’s paradox is not limited to two groups of data, we can have many more and these groups could be things such as age groups, species, gender.
Kidney Stones
An interesting real example is one from a medical study which looked at different kidney stone treatments and how successful they were for different sizes of kidney stones. One of the treatments was a new less invasive treatment and the other was the current treatment. The findings for the success of the two treatments is as below. The percetage is the success rate and in the brackets we have (number of successes / total cases).
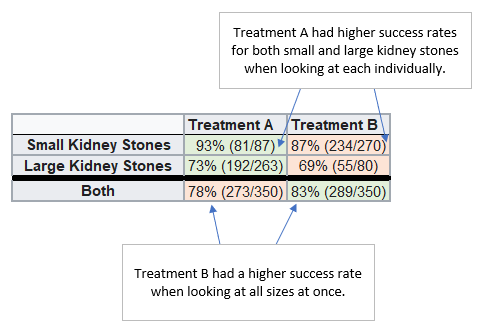
When looking at the treatments for small stones and large stones individually, it is clear that the conclusion you would draw is treatment A is more successful. However, when you combine these and look overall, you would think treatment B was more successful.
Here a larger proportion of those with small stones received treatment B while a larger proportion with large stones received treatment A. If these had equal proportion then we would not have seen these results which follow Simpson’s paradox. The size of the kidney stone has greater influence on the success of a treatment than the choice of treatment.
This brought to light that perhaps it is important to consider the size of kidney stones when testing treatments. It was not previously known to be an important consideration until they found this contradictory conclusion in the study.
It definitely highlights that you should not make overall conclusions without further analysis. There could be a number of factors that are being ignored when you make casual interpretations based on a summary. There are many other examples where Simpson’s paradox has been observed, such as comparing batting averages for baseball players over different years vs all the years together, and looking at gender bias in admissions to the University of California graduate school when split by department vs overall. Simpson’s paradox has even been seen within the COVID figures, looking at the Case Fatality Rates for China and Italy it appeared that Italy had a higher survival rate but when split by age demographic the opposite conclusion can be made. Check out this great video How SIMPSON’S PARADOX explains weird COVID19 statistics which discusses this.
References