If I mention a graph most of us first think of a scatterplot or a bar chart or something we could create in Excel. However, in mathematics, when we speak about graphs and graph theory this usually relates to a structure which is used to represent relationships between objects.
So what does that mean exactly? Well a graph is an ordered pair \(G = (V,\, E)\) where
- \(V\) – a set of vertices (aka nodes).
- \(E\) – a set of edges, each edge connects 2 vertices (though it can be the same vertices if we allow loops). So an edge can be written in the form \(e_1 = (v_1, v_2)\) where \(v_1,\,v_2\) are in \(V\).
For example,
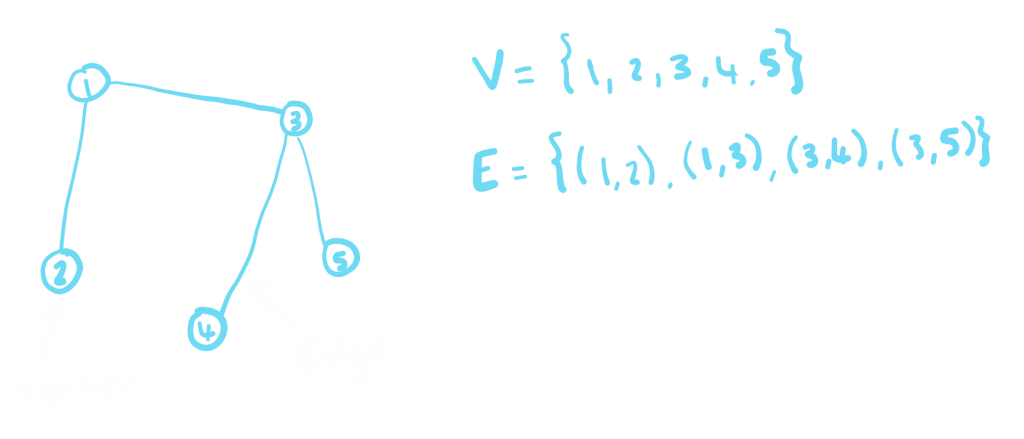
We refer to the number of edges that are attached to a certain vertex (or incident to it) the degree of that vertex. For example, in the graph above vertex 1 has degree 2 and vertex 2 has degree 1. If all vertices have the same degree this is known as a regular graph.
We can introduce some more terminology and examples:
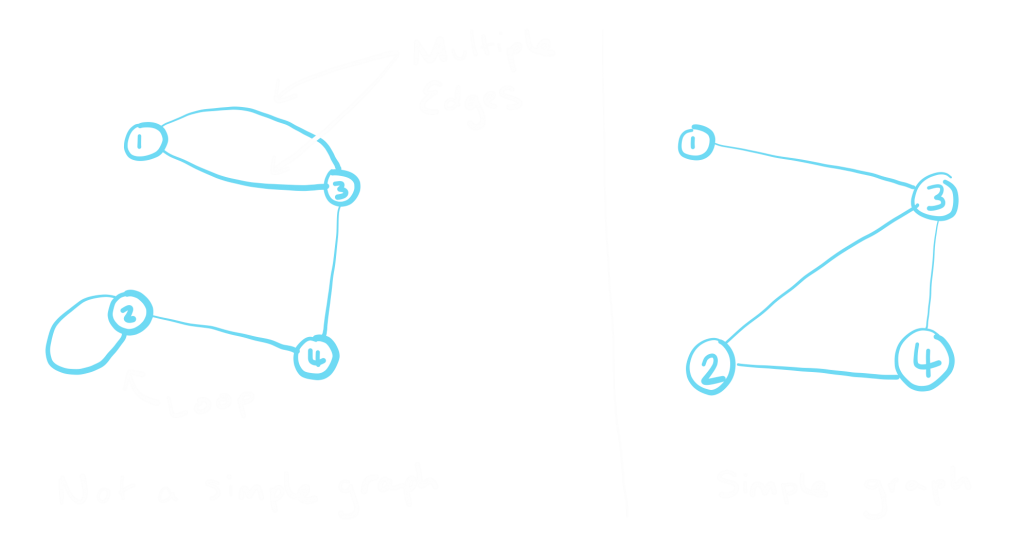
- Loop – an edge that connects a vertex to itself (e.g \(e_1 = (v_1,\,v_1)\) for some vertex \(v_1\) in \(V\))
- Multiple Edges – if two vertices have more than 1 edge connecting them (e.g \(e_1 = (v_1,\,v_2)\) and \(e_2 = (v_1,\,v_2)\) for some vertices \(v_1,\,v_2\) in \(V\))
- Simple graph – a graph with no loops or multiple edges.
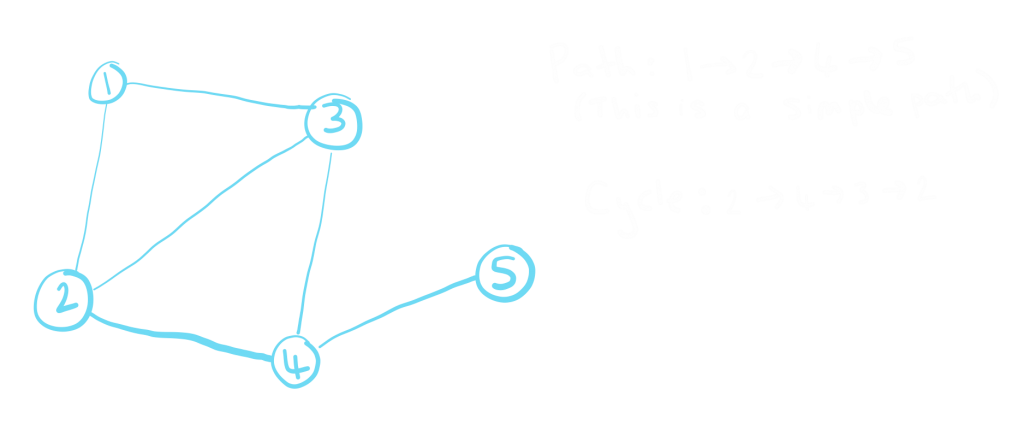
- Path – a sequence of vertices in which each vertex in the path is connected by an edge to the next vertex in the path. If no vertices in a path are repeated this is called a simple path. A path has no repeated edges.
- Cycle – a path that starts and ends with the same vertex and not visit any other vertex more than once (apart from the start/end vertex).
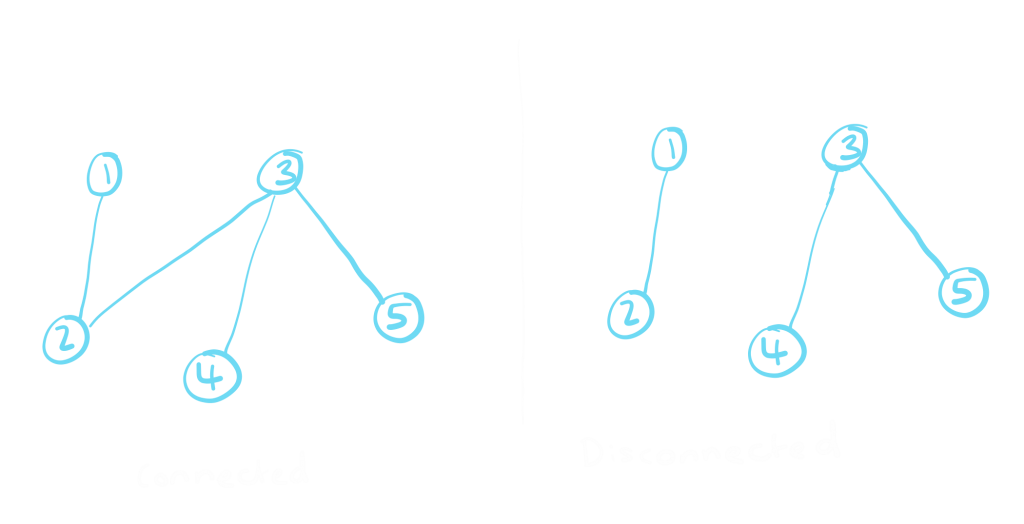
- Connected graph – a graph is connected if, for any two vertices, there exists a path between them.
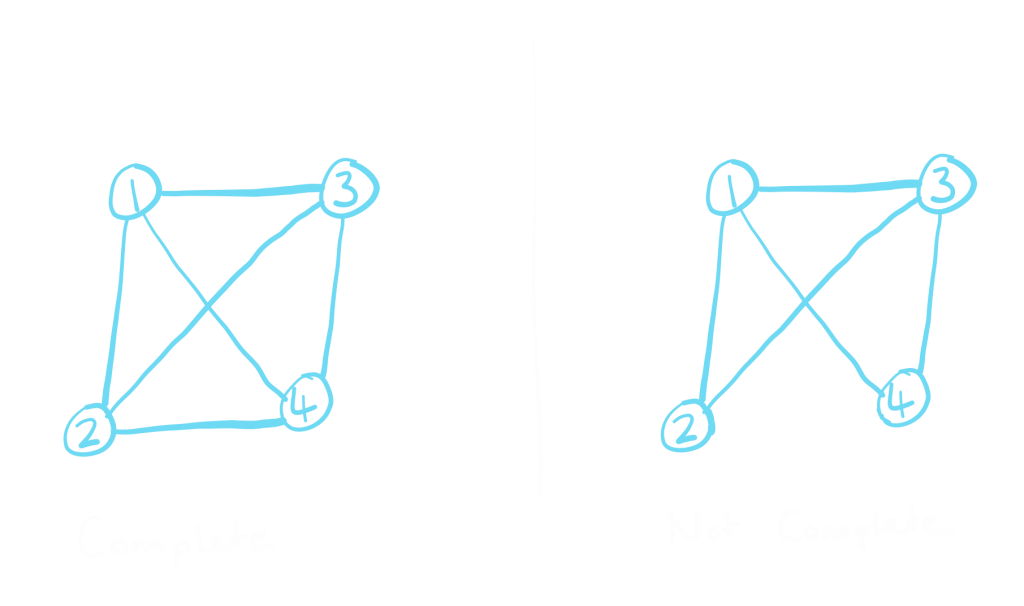
- Complete graph – a graph is complete if, for any two vertices, there exist an edge that connects them.
Matrix representation
We can also describe these graphs using matrices.
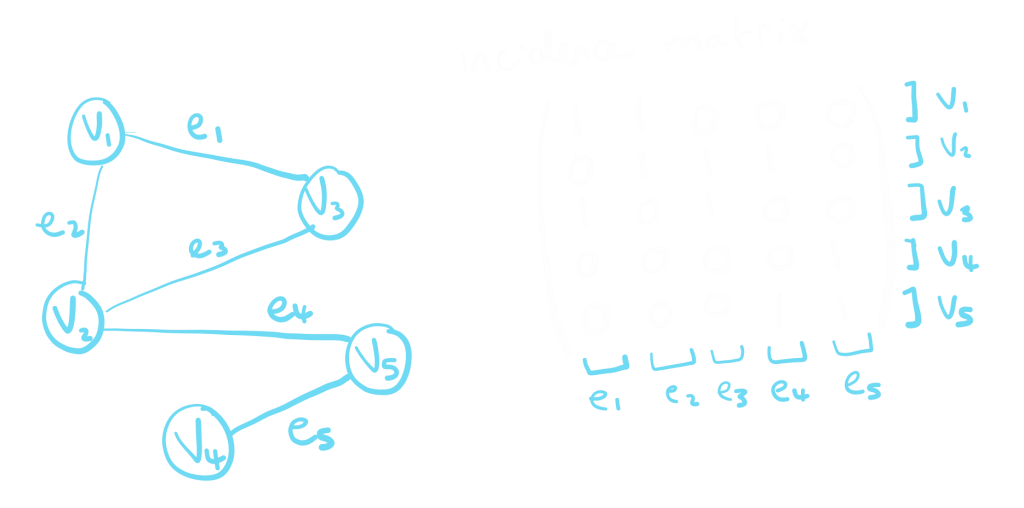
- The incidence matrix is used to record which edges connect up which vertices. The columns of the matrix represent the edges and the rows represent the vertices. If a vertex is joined to another by an edge then the matrix will have a 1 in the appropriate position in the matrix and a 0 otherwise.
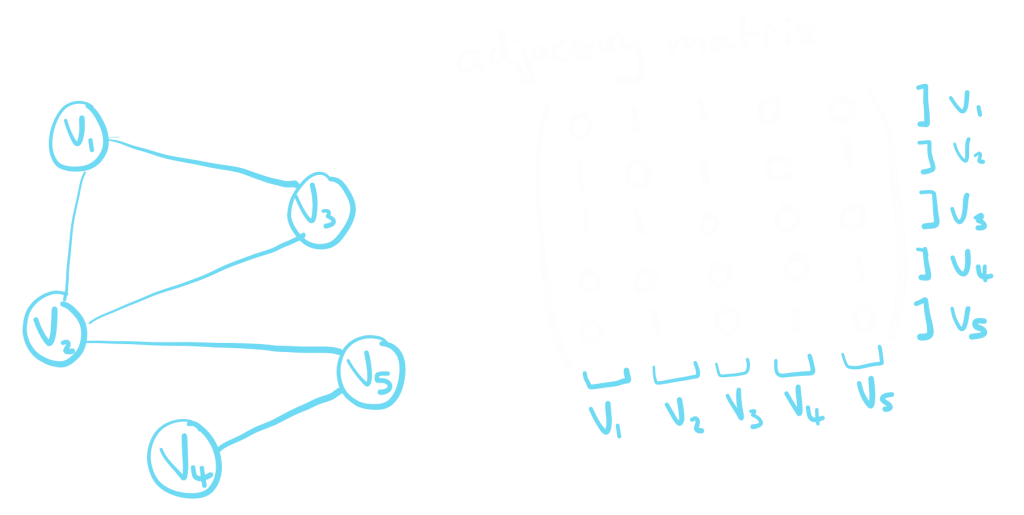
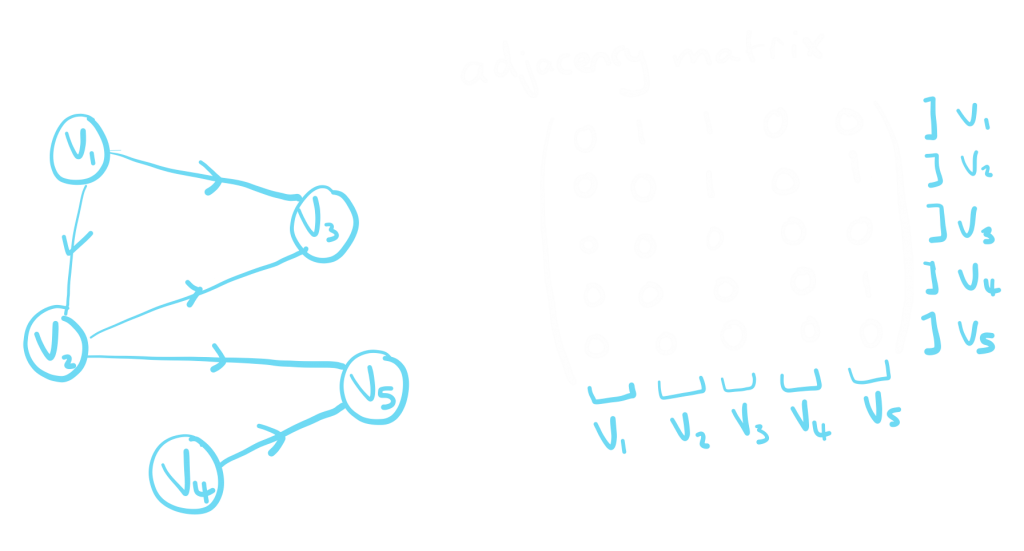
- The adjacency matrix is used to record which vertices are joined by an edge. Both the columns and rows represent the vertices. If two vertices are joined then the matrix will have 1 in the position that corresponds to that pair and a 0 if the vertices are not joined.
Bipartite graph
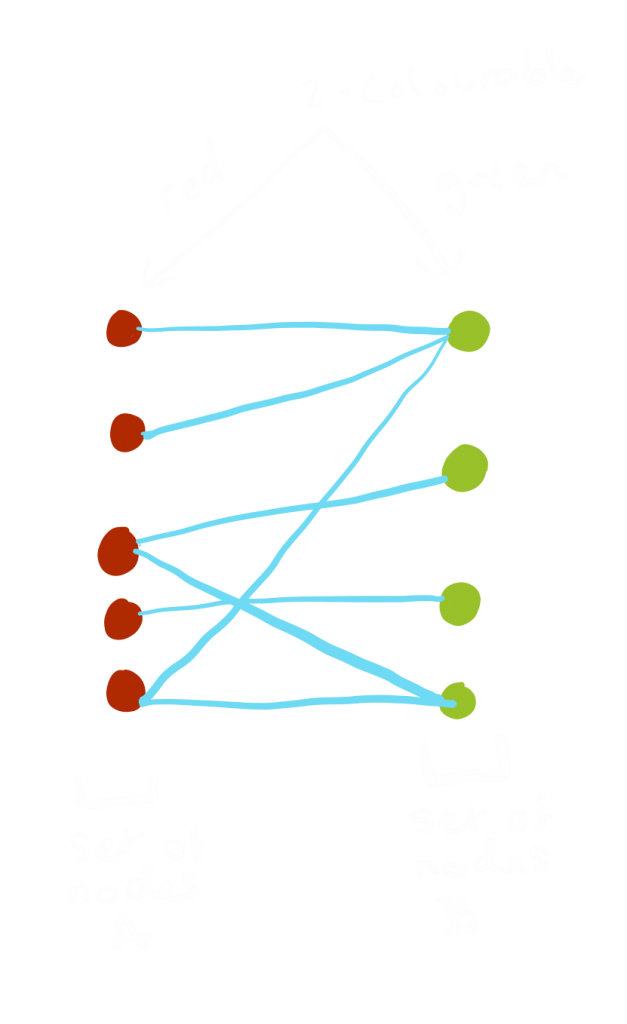
A bipartite graph is a special type of graph where the vertices are split into two sets. No two vertices in the same set can be connected by an edge. Instead edges join a vertex from each set together. If you have a bipartite graph then it is 2-colourable, that means that you could colour in the vertices in such a way that no two vertices connected by an edge have the same colour and you could do this using only 2 distinct colours.
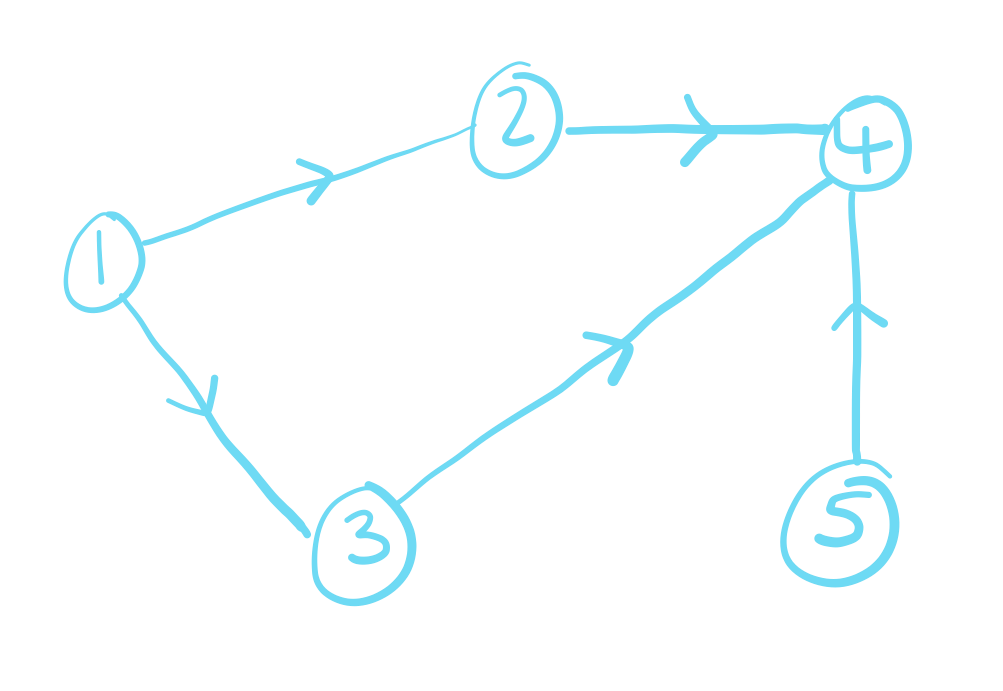
Directed graphs
We can add direction to the edges on a graph. This can be used to represent flow or This means the order in which you list the vertices when writing an edge matters i.e in a ordered graph \( e_1 = (v_1,\,v_2) \neq (v_2,\,v_1) = e_2 \).
While the adjacency matrix for undirected graph are always symmetric, it is slightly different for directed graphs so it is likely that it is not symmetric. Rather than putting a 1 in the row that corresponds to both vertices that are joined by an edge, for directed graphs if the direction of the edge is going from some vertex \(i\) to another vertex \(j\), then we would put a 1 in row \(i\) column \(j\). The entry in row \(j\) column \(i\) would be 0 unless there was an additional edge that went from vertex \(j\) to another vertex \(i\).
Examples of use
As graph theory looks at the relationships between things it can be very useful to display things where we have these. One interesting examples is social networks – we can create graphs displaying the facebook friends with the vertex being a persons profile and the edge representing which profiles are friends with each other. In fact, graph theory is actually behind search engines such as Google, this uses weighted edges and an algorithm called PageRank. All webpages are the vertices and each hyperlink on the webpage is an edge connecting them. Each page will recieve a rank based on the quality of the hyperlinks that are connected to it, the number of hyperlinks etc. When a user searches a page it will match this search query up with pages displaying details that it believes are equivalent and will show pages with the highest rank first. For more information on how PageRank works check out the original paper in the references section below and I’ve also linked a great blog post that I found which explains how it works in more detail along with some other interesting information.
References
Paper on Googles PageRank system – The Anatomy of a Search Engine (stanford.edu)
Google PageRank blog post Google PageRank is NOT Dead: Why It Still Matters (ahrefs.com)