In this blog post, I will discuss a very popular area (particularly at Lancaster University) in statistics called Changepoints Analysis. Changepoint analysis has been an important field of study, with publications dating all the way back to the 1950’s. The applications of changepoint analysis can be found in many areas such as medicine and finance; recent applications include surface temperature modelling for liver procurement, global terrorism incidence, and analysis of BRICS currency returns. This post will go through what changepoints are, how we can detect them, and how they can be used to affect our lives.
What is changepoint analysis?
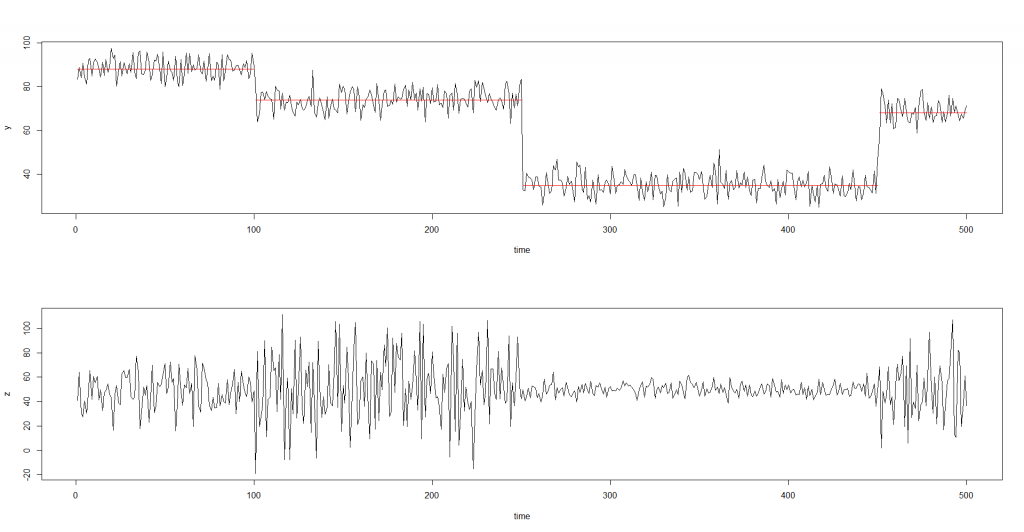
Changepoint analysis is all about dealing with time series data. Time series data is just data that is ordered sequentially, e.g. in time order. This can be anything from stock level prices across a few years or my daily step count from my Fitbit (admittedly, not a lot). Time series data gives us a snippet in time to how the structure of the system we are interested behaves. Often, we are interested in the underlying distribution of a system, e.g. given the daily step count across the past few weeks, what is the average number of steps per day and how does this fluctuate. If life was easy, the underlying distribution of a system would be the same across all of time. However, life is rarely that simple and often we get data where the statistical characteristics (e.g. the average) seem to suddenly change at different points in time. These points in time are called changepoints. Below shows two different types of changes, changes in mean and changes in variance.
Time series data with changes in mean (first plot, red line showing the mean) and changes in variance (second plot. In both cases, the changepoints are at time points 100, 250, and 450.
Therefore, changepoint analysis is just the study of identifying these changepoints within the data. A changepoint method is a way of detecting these points in time in the data and these generally come under two categories: offline detection methods and online detection methods.
Offline changepoint detection methods search for points in time when all the data has been collected. For example, I can take all the step count data that my Fitbit has collected up until now and then analyse at which point in time my average number of steps per day changed (spoiler: it was March 23rd 2020).
Online changepoint detection method search for points time as the data is coming in. For example, internet devices send data reporting on the quality of the connectivity. However, if a small part of the device starts to become faulty, then the quality of the internet connection may slowly deteriorate and by the time we notice a change, it could cause lots problems. Therefore, being able to detect a change in the system early on as the data comes in is vital to avoid lots of problems down the line (and to avoid lots of dissatisfied customers).
How do we calculate changepoints?
As this area has been studied since the 1950’s, there have been many methods created to finding changepoints within the data. Here we’ll discuss a simple, and very popular and widely used, offline detection method called binary segmentation and it works like follows.
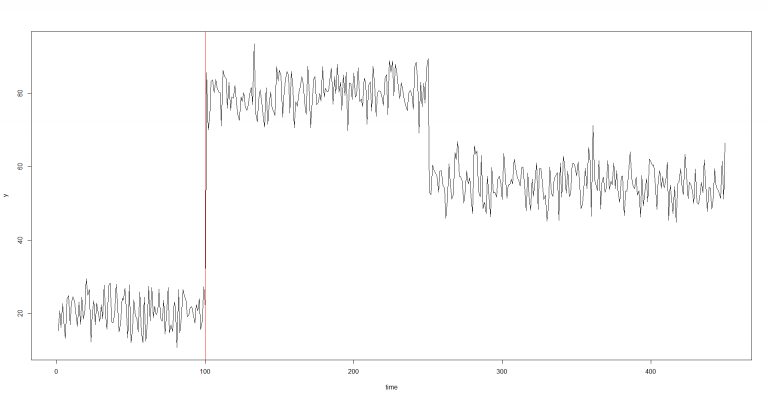
As this is an offline method, we have all the data available to us. For each data point, perform a fancy statistical test to see how likely it is that at that time point, there is a change in the data (e.g. a change in the mean, variance, etc). Once you’ve tested every single point, the point with the biggest probability of being a change will then become your first changepoint. From this, we can split the data into two. An example of this is shown below.
Plot showing the first changepoint being found using Binary Segmentation. The data is split into two about this point, shown as a red line.
As the data is now split into two, we can consider each part as a new time series. So then we repeat the above process on both parts and continue to split the data until we have found all the changepoints.
Pretty simple method right? Find the biggest change in the data, split the data at this point, and then repeat until no more changes can be found. Despite the simple concept, this method is very popular due to it’s simplicity and has been used in many applications. Improvements have also been made to this method, just search for Wild Binary Segmentation and Circular Binary Segmentation.
Conclusion
This blog post has only just scratched the surface of changepoints. There are many more methods out there, like PELT, and many more areas where changepoints can be useful. For example, the company Howz (passively) monitors daily activity levels of elderly people who live alone and examines daily patterns using changepoints. Howz can then use this knowledge to inform the relatives of these elderly people of any abnormal behaviours in there daily patterns with the goal of preventing serious health problems. So changepoints can be used in many settings and can be used to improve our daily lives. If you’re interested in finding out where, check out the links below!