
Introduction
One of the only things that is certain about the world, other than death and taxes, is that it is uncertain. Statistics is the tool we humans have contrived to attempt to deal with this uncertainty or at least to give us some idea of what to expect. I wanted to start this STOR-i blog with a post about the S, statistics, and it’s hard to imagine a situation in which bigger decisions are made in the face of more drastic uncertainty, at least in monetary value, than the financial markets.
Naturally, this uncertainty means that the use of statistics is almost ubiquitous in finance. Almost every big financial decision is made with knowledge of what market data obtained in the past can tell us to expect in the future. It is true, just like in all statistical disciplines, that there isn’t a crystal ball that can say with absolute certainty what will happen in the future. In fact, finance is probably the shining example of what can go wrong if this fact is ignored. However, the insights gleaned using statistics give investors a more informed idea of what they should invest into to suit the level of risk they are personally willing to tolerate and any other limits on investing they may have.
Modern Portfolio Theory (MPT)
Portfolio Optimisation is a statistical tool used in finance to try and quantify the uncertainty associated with a collection of assets, be these stocks, currencies, commodities, bonds etc., based on their historical performance. As it turns out, the statistics behind portfolio optimisation is quite simple, at least in its original iteration known as Modern Portfolio Theory (MPT). I say original iteration because attempts have been made to improve on certain limitations of MPT resulting in Post Modern Portfolio Theory. The original iteration and the focus of this post is based on the maxim given by Markowitz in his seminal paper on MPT. “The investor does (or should) consider expected return a desirable thing and variance of return an undesirable thing”. Let’s break this down. Starting with what is fairly self explanatory, expected return is the money that is expected to be made (or lost) on an asset in a certain period of time based on its previous values. Variance of return is a statistical measure of the historical spread of an assets value around its expected value. Variance is a natural choice for a risk measure because an asset with low variance has stayed close to its expected value in the past and as a result is considered less volatile or risky. Typically, the square root of the variance known as the standard deviation is used to represent the variance because it has the same dimensions as the expected return.
It is important to note that we are looking at a portfolio of assets here and not just a single asset. This means that there are additional considerations at play. The main thing to consider is the correlation between the different assets in the portfolio. Correlation is a numerical value that lies between -1 and 1. If two assets have positive correlation then if one of them goes up in value the other will also do so. This is useful to know but it is more interesting if two assets have negative correlation. If this is the case, it is expected that when one of them goes down in value, the other one will go up. Having a portfolio with two negatively correlated assets means that we would expect some kind of mitigation when a asset falls due to the other rising at the same time. This has the effect of making the portfolio less risky as a whole. This is what people in finance mean when they say a portfolio should be diverse, it should have a range of assets that perform differently in response to the market so that the portfolio is more safegaurded from these changes.
So, how can we the ideas behind MPT in practice to help inform investments? It’s easier than you probably thought. It must be said that this analysis would probably be impossible without the use of computer software because of the amount of data involved and the number of calculations needed. To this end, popular programming language MATLAB has an entire toolbox dedicated to performing these calculations in just a few easy steps. Alternatively, it is possible to do the calculations yourself in python but it isn’t as user friendly. For the purpose of this blog, I will give a very brief overview of how I was able to produce the plot shown at the bottom of this section. First, stock market data must be imported from a website such as yahoo finance. This data consists of stocks and their daily closing values for a chosen time period. The data can then be manipulated in python to calculate the variances, correlations and expected returns. It is then possible to work out the expected returns (ER) and standard deviations for portfolios in which different proportions of money have been invested into different stocks.
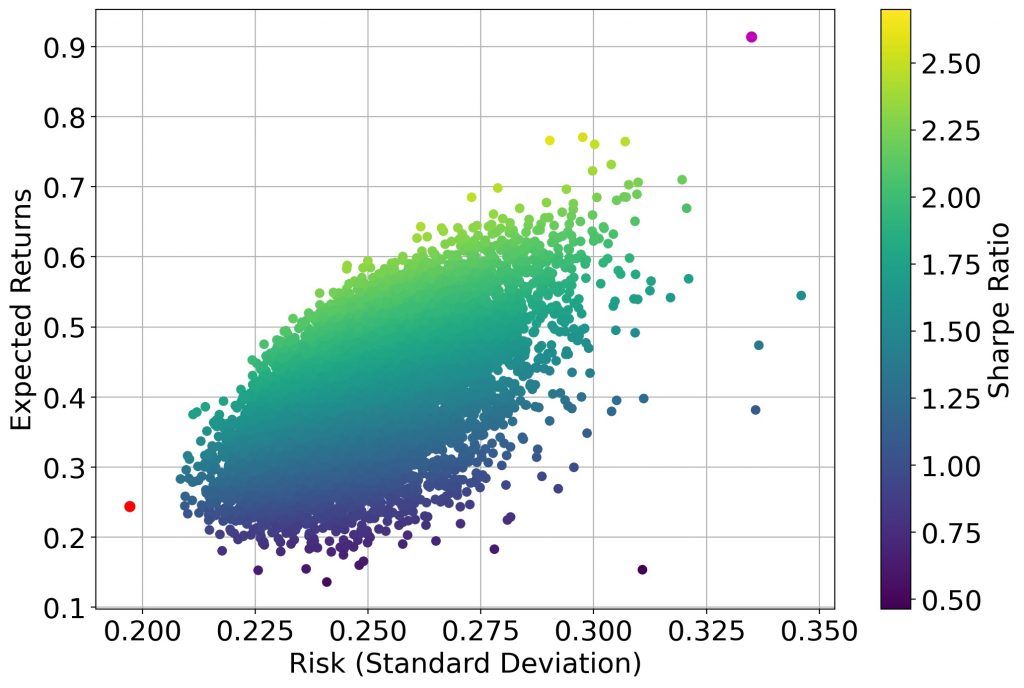
In the graph below, one method of optimizing these different proportions is shown. The data used here is the stock market data from the past five years for a selection of ten stocks. The method involves choosing a random proportion of each stock so that all the money has been invested across all the stocks. This is repeated a large number of times and then the resulting ER and Risk is plotted for each. As can be seen from the plot, this produces a large number of different portfolios with a range of ER and risks. The points that lie on the top left edge of the plot are on what is called the efficient frontier. These portfolios are the ones that maximise the expected returns for a given level of risk and should always be chosen in favour of points that lie below and to the right. The points in the graph are coloured according to a quantity known as the Sharpe Ratio associated with each portfolio. The Sharpe Ratio is a simple mathematical formula that gives a value showing how large the expected return of a portfolio is relative to its risk. Naturally, points on the efficient frontier tend to have a high Sharpe Ratio. The point in magenta shows the portfolio with the largest Sharpe Ratio. Naturally, it has a very high return but it comes along with a very large risk which means it may not be the best choice for a lot of people. The point in red shows the portfolio with the smallest risk which can be a good choice for those who have a nest egg they are content to grow slowly with the minimum possible chance of losing a big chunk of it.
Conclusions
I’d like to use this conclusion space to reiterate that this method is purely based on the historical value of the assets in the portfolio. It gives nothing but information about what stocks to choose if the market was expected to perform the same in the future as it did in the past. We all know that this is not the case and the portfolio shown to have the lowest risk here could be the one that sinks the hardest if the perfect storm occurs.
However, this is a great tool to use if you want to try and get an idea about how much of each stock should make up your portfolio for a given level of risk that you are comfortable with. If you are a strong earner and then you may be prepared to take a big risk to try and make a big return. On the other side of the coin, you may just want to make a modest return with a lower expected risk.
If you enjoyed this blog post and want to learn more in depth about the topics covered or want to explore further topics try some of the links at the end of the page. I reccomend looking into alternative risk measures that have been developed to overcome the limitations of variance. A particularly important measure is known as Continuous Value at Risk (CVaR). CVaR is known as a tail-risk measure because it only looks at the left-hand tail of the distribution of previous values unlike variance which looks at the overall spread.
Relevant links
Investopedia – A useful dictionary of all things finance
Markowitz’s original paper on MPT
Intimately, the post is realistically the most excellent on this worthy field. I partially agree with your conclusions and will desperately expect your coming updates. Just saying thank you will not just be enough, for the fantastic clearness in your writing. I will instantly get your feed to keep privy of any updates. Very good work and much success in your business efforts. May god bless you, !