

Assessing the Impact of the United Kingdom’s Covid-19 Lockdown on Nitrogen Dioxide levels.
Posted on

This post summarises work done by me (Thomas Pinder), Michael Hollaway, Christopher Nemeth, Paul Young and David Leslie.
In March 2020 the United Kingdom (UK) entered a nationwide lockdown period due to the Covid-19 pandemic. With less people travelling in their cars, levels of the atmospheric pollutant nitrogen dioxide (NO2) dropped. Although this drop could be analysed from individual monitoring stations, we wanted to exploit statistical techniques to provide a complete spatial representation of the NO2 change. Therefore, in a recent piece of work (Pinder et. al., 2020a), we used over half a million NO2 data points from 237 monitoring stations in the UK to build a spatiotemporal Gaussian process (GP) capable of predicting NO2 levels across the entire UK. This post provides a brief description of the model we constructed, the data used, and the work’s key findings.
Datasets

Hourly data from a network of 237 monitoring stations provided a constant stream of NO2 values [1] where the effects of weather have been removed using RMWeather. Despite the abundant temporal information this data provided, the stations’ spatial dispersion was inhomogeneous, being sparse in some places whilst dense in others. For this reason, a Gaussian process was used to spatially interpolate between the stations, but more on this later.
To supplement the spatiotemporal NO2 measurements, we also made use of covariate information from four auxiliary datasets that describe wind speed, wind direction and temperature (Hersbach et. al., 2020), and land type for Great Britain (Morton et. al., 2020a) and Northern Ireland (Morton et. al., 2020b). Land type classification varied only in space whilst the other three datasets were all of a spatiotemporal nature and had values defined on a uniform 9x9km grid. The land classification dataset records each 25x25m grid cell in the UK as one of 21 different land classes. To extract a measure of how urban a given region of the UK is we upscaled the data onto a 200x200m grid and computed the proportion of constituent grid cells that were classed as urban (two of the 21 available classes).
Model
To learn the spatiotemporal dynamics of UK NO2 from March 2020 through to June 2020, we employed a Stein variational Gaussian process (Pinder et. al., 2020b) in order to facilitate a fully Bayesian workflow with efficient posterior inference.
Prior beliefs around the smoothness of the observed NO2 can be posited into the GP through selection of kernel functions. The Matérn family of kernels is one such example of a kernel where the higher-order Matérn kernels yield a smoother response. With this in mind, a third-order Matérn kernel was used to describe the model’s spatial correlation, whilst a first-order Matérn kernel and polynomial product kernel was used to capture the fluctuant temporal dynamics present in the data. In the full model, we used a mixture of inverse Gamma and Gaussian priors for the kernel’s hyperparameters and the model’s covariates.
Scalability in the GP was induced through a set of 800 inducing points. We further used 30 particles to approximate the GP posterior. All training was done on a GPU and inference on the full dataset, comprised of 550,134 observations, took just under six minutes using our accompanying software package.
Findings
NO2 reduction: If we compare the integrated spatial mean NO2 levels for 9AM on March 16th (one-week pre-lockdown) and 9AM on March 30th (one-week post-lockdown), then we can see that NO2 levels decreased by 36.8%. This decrease was most pronounced in cities and urban areas (Figure 1).
Deviation from normal trends: While a clear reduction in NO2 is apparent across the pre and post-lockdown period, we would also like to give more context to the apparent decrease by comparing to levels in previous years. To define a normal trend, we consider data from February 1st to April 30th in 2019. Comparing the latent function that is learned in 2019 to the latent function that corresponds to data from the same period in 2020, we can see the effect that lockdown had on NO2 levels, relative to expected temporal changes from 2019.

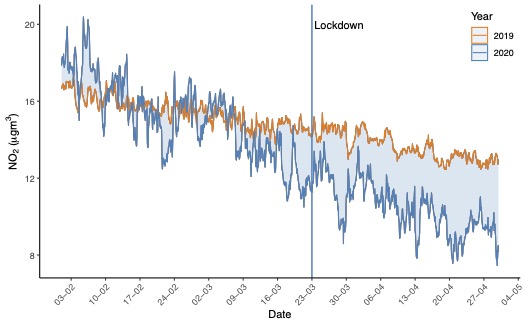
Quantitatively, by computing the integrated spatiotemporal mean for data from February 1st through to March 23rd in 2019 and 2020, we can see that NO2 levels are 9% lower in 2020 compared to levels in 2019. However, if we now compute the integrated spatiotemporal mean for data from March 23rd through to April 30th in 2019 and 2020, then we can see that levels in 2020 are now 38% lower. This can be seen in Figure 2 where we plot the difference in NO2 levels from 2019 to 2020, integrated over the temporal values from March 23rd to April 30th. In all locations, NO2 values are lower in 2020 when compared to 2019. Moreover, we can see that the decrease is greater in cities and the more urban areas of the UK compared to the more rural regions. For illustrative purposes, we can also see this temporal change in Figure 3. Here we observe the inferred time series at a single location (51.5oN, 0.1oW) that corresponds to Westminster in London, UK, where it is apparent that the divergence in NO2 levels begins around March 23rd.
Where next?
Since March 2020, the UK has experienced two subsequent lockdowns: one in November 2020 and another in January 2021. In addition to this, regions of the UK were assigned region-specific restrictions in between lockdowns. It would be of great interest from both an environmental and statistic perspective if the work presented in this post could be extended to model NO2 levels from March 2020 through to the present day.
Further, NO2 is not the only pollutant whose levels are impacted by reduced travel. Adapting this framework to model alternative pollutants, such as particulate matter, would also be of great significance in understanding how lockdowns have impacted our atmosphere.
References
Hersbach, H., Bell, B., Berrisford, P., Hirahara, S. et. al (2020). The ERA5 global reanalysis. Quarterly Journal of the Royal Meteorological Society, 146(730):1999–2049, https://doi.org/10.1002/qj.3803.
Morton, R. D.; Marston, C. G.; O’Neil, A. W.; Rowland, C. S. (2020). Land Cover Map 2019 (25m rasterised land parcels, GB). NERC Environmental Information Data Centre, https://doi.org/10.5285/f15289da-6424-4a5e-bd92-48c4d9c830cc
Morton, R. D.; Marston, C. G.; O’Neil, A. W.; Rowland, C. S. (2020). Land Cover Map 2019 (25m rasterised land parcels, N. Ireland). NERC Environmental Information Data Centre. https://doi.org/10.5285/2f711e25-8043-4a12-ab66-a52d4e649532
Pinder, T., Hollaway, M., Nemeth, C., Young, P. J., & Leslie, D. (2021). A Probabilistic Assessment of the COVID-19 Lockdown on Air Quality in the UK. arXiv preprint arXiv:2104.10979.
Pinder, T., Nemeth, C., & Leslie, D. (2020). Stein Variational Gaussian Processes. arXiv preprint arXiv:2009.12141.
Related Blogs
-

Annual meeting of the Society for Decision Making under Deep Uncertainty, 2022
-

The Cryosphere 2022 Conference
-

DSNE Reseachers receive best poster award at CDE Conference 2022
Disclaimer
The opinions expressed by our bloggers and those providing comments are personal, and may not necessarily reflect the opinions of Lancaster University. Responsibility for the accuracy of any of the information contained within blog posts belongs to the blogger.
Back to blog listing