Interpreting air pollution during the COVID-19 lockdown
Posted on

Interpreting air pollution during the Covid19 lockdown
The Covid19 lockdowns provide environmental scientists with a great opportunity to study how a slower economy impacts air pollution, but we need to be careful with our analysis according to Lancaster University’s Dr Paul Young.
One of side effects of the lockdowns has been a reduction in our polluting activity, due to shuttered factories, offices and shops, and drastically reduced travel. But how the impacts play out are not as simple as they might initially seem.
While some impacts are more nuanced than commonly reported, such as the return of dolphins to Venice’s canals, the reduction in air pollution has been robustly reported from a variety of ground-based and satellite measurement platforms. We can also see blue skies over a normally highly polluted Beijing, reminiscent of the pollution control efforts during the 2008 Olympics or the 2014 Asia-Pacific Economic Cooperation (APEC) summit.
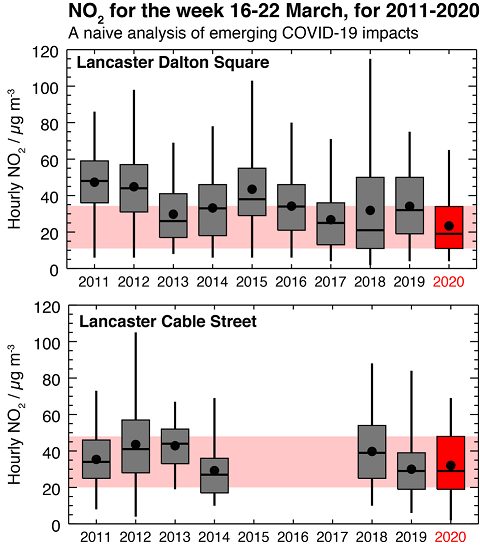
Anyone with an interest in this can download and look at air pollution data, including from websites like openaq.org. As an example, here I’ve looked at two city centre sites in Lancaster, where I’m based, and whose data are available here.

The plot above shows the levels of the pollutant NO2 (nitrogen dioxide) for the same 7-day calendar period since 2011, illustrated using a box plot: 25th-75th percentiles in the boxes, full range of the data with the vertical lines, median as a horizontal line and a dot as the mean. This 7-day period is consistent with the most recent data available. It corresponds with the beginning of the government’s recommendation to begin social distancing on the 16th, although it does not include the stricter lockdown from the 23rd March.
Very naively, looking at Dalton Square we might say that the week 16-22 March in 2020 does indeed have notably lower NO2 pollution than the same week during most of the years. But something different is going on for Cable Street where NO2 is not clearly different from other years. What this illustrates is that the measurement data by themselves do not tell the whole story and if we want to quantify the impact of these emission reductions we need to account for how other factors can influence air pollution levels.
Other than emissions, the most important factor is the weather. Its impact is something that we can likely rationalise from our own experience. For instance, think about hazy days in a heatwave, where the pollution can be trapped in stagnant air, or winds bringing Saharan dust storms to the UK, or the clearer views we get after some rain.
Accounting for how weather influences air pollution is something that several researchers on our Data Science of the Natural Environment (DSNE) project are currently working on, but an excellent example of how to do it for COVID-19 comes from David Carslaw at Ricardo. Using regression trees and random forests, David has developed data models that are able to predict air pollution levels given particular meteorological variables (temperature, wind speed etc). In his COVID-19 analysis, David compares his model’s prediction – which you can think of as what would have happened in the absence of the lockdown – against what was actually measured. For several sites across the UK, he shows an increasing disparity between his model’s prediction and the measurements, consistent with a quantifiable, lockdown-driven decrease in air pollution levels.
Other statistical tools and process models could be used to explore and quantify the impact of the COVID-19 lockdowns on air pollution and could be applied to different questions: what the impacts are on pollutants other than NO2, such as ozone whose levels are increasing at many sites due to its complex chemistry; how we can infer lockdown impacts in more sparsely monitored locations, including the Global South; and whether more people at home will drive up household emissions, such as from wood burning stoves. We might also ask whether an enhanced bounce back of economic activity – perhaps in a more loosely regulated environment – could cause drastic rises in pollution?
Researchers will also want to know the extent to which any lockdown-driven air pollution reductions will have had benefits for human health. These would need to be weighed against any change in our exposure to indoor air pollutants, which will likely have increased over the same period.
Finally, researchers are already interested in whether the reduced emissions and slower economy of the lockdown conditions provide insight into the kinds of transitions we will need to embrace if we are to meet the obligations outlined in the Paris Agreement and the UN Sustainable Development Goals.
From the point of view of environmental data science, this is a rich and important area. Any tools developed to understand the impacts of the COVID-19 lockdown will also help us evaluate the efficacy of past air pollution policies as well as helping to evaluate and develop future interventions. You can expect a lot of publications on this in the coming months and years!
Related Blogs
Disclaimer
The opinions expressed by our bloggers and those providing comments are personal, and may not necessarily reflect the opinions of Lancaster University. Responsibility for the accuracy of any of the information contained within blog posts belongs to the blogger.
Back to blog listing


