

Mapping the regrowth of forests in the Brazilian Amazon.
Posted on

The Amazon is the largest remaining expanse of tropical rainforest in the world and represents an enormous reservoir of terrestrial carbon1. As the forest grows, it takes carbon from the atmosphere and stores it as biomass. However, this important ecosystem also has the world’s highest rates of forest clearance, which threatens its effectiveness as a carbon sink.2
Deforestation in the Amazon is an environmental crisis that has been ongoing for decades, with more than a fifth of the forest having already been cleared.3 Much of the cleared vegetation is burned, releasing vast quantities of carbon into the atmosphere and contributing to global climate change.
However, deforestation is not the end of the story. Land cleared for agriculture is regularly abandoned, enabling the growth of new, secondary forests that have the potential to be an important mechanism for reducing net carbon emissions.
In my latest paper, recently published in Global Change Biology, we explore the role of these secondary forests in offsetting carbon emissions from deforestation in the Brazilian Amazon.
Despite widespread acceptance of their importance for mitigating climate change through carbon sequestration, producing reliable estimates of secondary forest carbon stock has been hindered by a lack of spatially and temporally accurate data on their age and distribution. We encountered three key challenges in generating this data.
First, old-growth and secondary forests look almost identical in satellite images, making it practically impossible to distinguish between them. This prevents secondary forests from being readily identifiable in single year snapshots, making time series analysis essential.
Second, land use change in the Amazon is not limited to large-scale, mechanised deforestation. Much is conducted by small landholders who may only clear 2-3 hectares per year. As a result, relatively high-resolution imagery is necessary to accurately map their location.
Third, secondary forests can be cleared and regrow multiple times in the same location. This means that unlike for old-growth forest, which once cleared is gone forever, it is not possible to create mask to restrict the region of analysis. Thus, change detection must be conducted on every pixel, for every year in the time series.
On a local scale, such analysis is not an issue. But as you scale up the sheer volume of data presents a significant computational hurdle. The Brazilian Amazon alone covers almost a quarter of the South American landmass. To map the region at 30m resolution requires 9 billion pixels, which across the 32-year time series equates to processing 280 billion pixels.
One way of addressing this is to split the region into smaller, more manageable chucks which can be processed simultaneously. However, this method is only viable with access to a high-performance computing cluster, such as the Lancaster University HEC system. By transitioning to a parallel analysis, we were able reduce our processing time from over two weeks, to a couple of hours. These time-savings allow us to make minor changes to our analysis with relative ease and to keep up with the latest data releases.
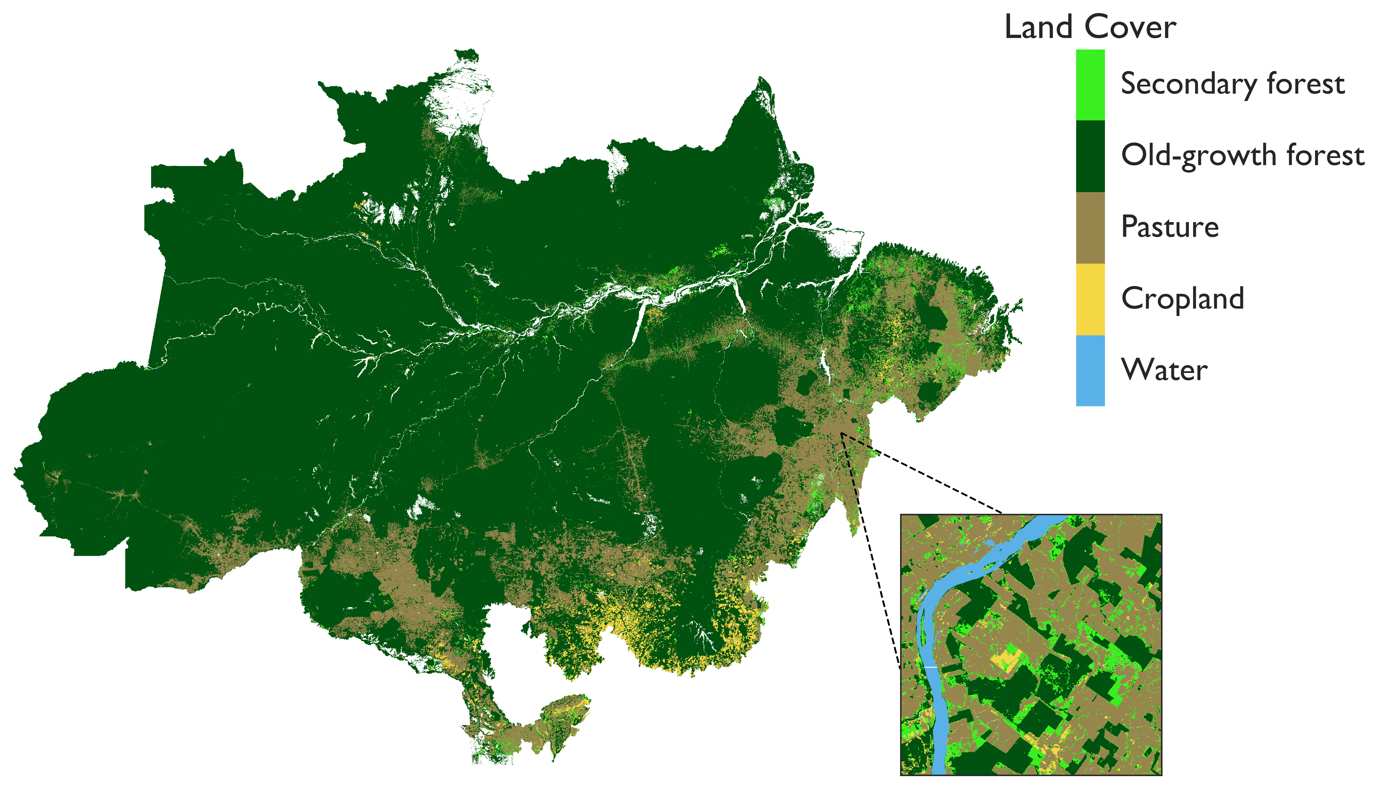
Figure 1: Land cover in the Brazilian Amazon with an inset showing the level of detail achieved by using 30m resolution imagery.
By overcoming these issues, using the MapBiomas 3.1 dataset, we were able to map ~130,000 km2 of secondary forest across the Brazilian Amazon, an area almost the size of England. Yet despite covering this enormous area, secondary forests have only offset 9.4% of deforestation emissions since 1985. We found that this low carbon stock can be explained by the high rate of clearance suffered by secondary forest, which means 85% of them are less than 5 years old and have not had time to store substantial quantities of carbon. As a result, secondary forests are not currently reaching their full potential as a carbon sink.
Ultimately, this work is a starting point for being able to reliably estimate secondary forest carbon stock and produce accurate maps of its distribution across large areas. In combination with research on secondary forest growth rates, it will provide the scientific basis upon which to build effective climate change mitigation policies.
References
1. Saatchi, S. S. et al. Benchmark map of forest carbon stocks in tropical regions across three continents. Proceedings of the National Academy of Sciences of the United States of America 108, 9899–904 (2011).
2. Hansen, M. C. et al. High-resolution global maps of 21st-century forest cover change. Science 342, 850–853 (2013).
3. PRODES. http://terrabrasilis.dpi.inpe.br/app/dashboard/deforestation/biomes/legal_amazon/rates (2020).
Related Blogs
-

Annual meeting of the Society for Decision Making under Deep Uncertainty, 2022
-

The Cryosphere 2022 Conference
-

DSNE Reseachers receive best poster award at CDE Conference 2022
Disclaimer
The opinions expressed by our bloggers and those providing comments are personal, and may not necessarily reflect the opinions of Lancaster University. Responsibility for the accuracy of any of the information contained within blog posts belongs to the blogger.
Back to blog listing