

Recognizing ice sheet melt: A study of north-eastern Greenland
Posted on

Recent studies of ice sheet melt show that extreme melt events contribute to sea levels rising and pose significant risks to coastal communities. It is essential to understand how ice sheets melt and to quantify melt events occurring on large ice sheets such as Greenland and Antarctica.
High resolution Synthetic Aperture Radar (SAR) backscatter from the Sentinel satellite were used in a pilot study to map changes in melting over time in the north-eastern region of Greenland. With the aim of developing statistical methods for forecasting ice sheet melt, I analysed the SAR time series images, using several statistical methods and techniques, to delineate important glaciological features and explore variations in space and time:
Binary classification and edge detection. For the detection of large-scale melt events, I considered a two-step approach that combines thresholding and edge detection. Thresholding is a basic image segmentation technique that allows us to use the brightness level of the backscatter image to create binary images. By labelling pixels above the threshold as non-melt, and pixels below the threshold as melt, I converted grayscale images of the ice sheet to binary images. The Binary images are a coarse representation but fast and easy to compute. Edge detection then extracts the boundaries of ice sheets, outlining ice shelves and other important glaciological features.
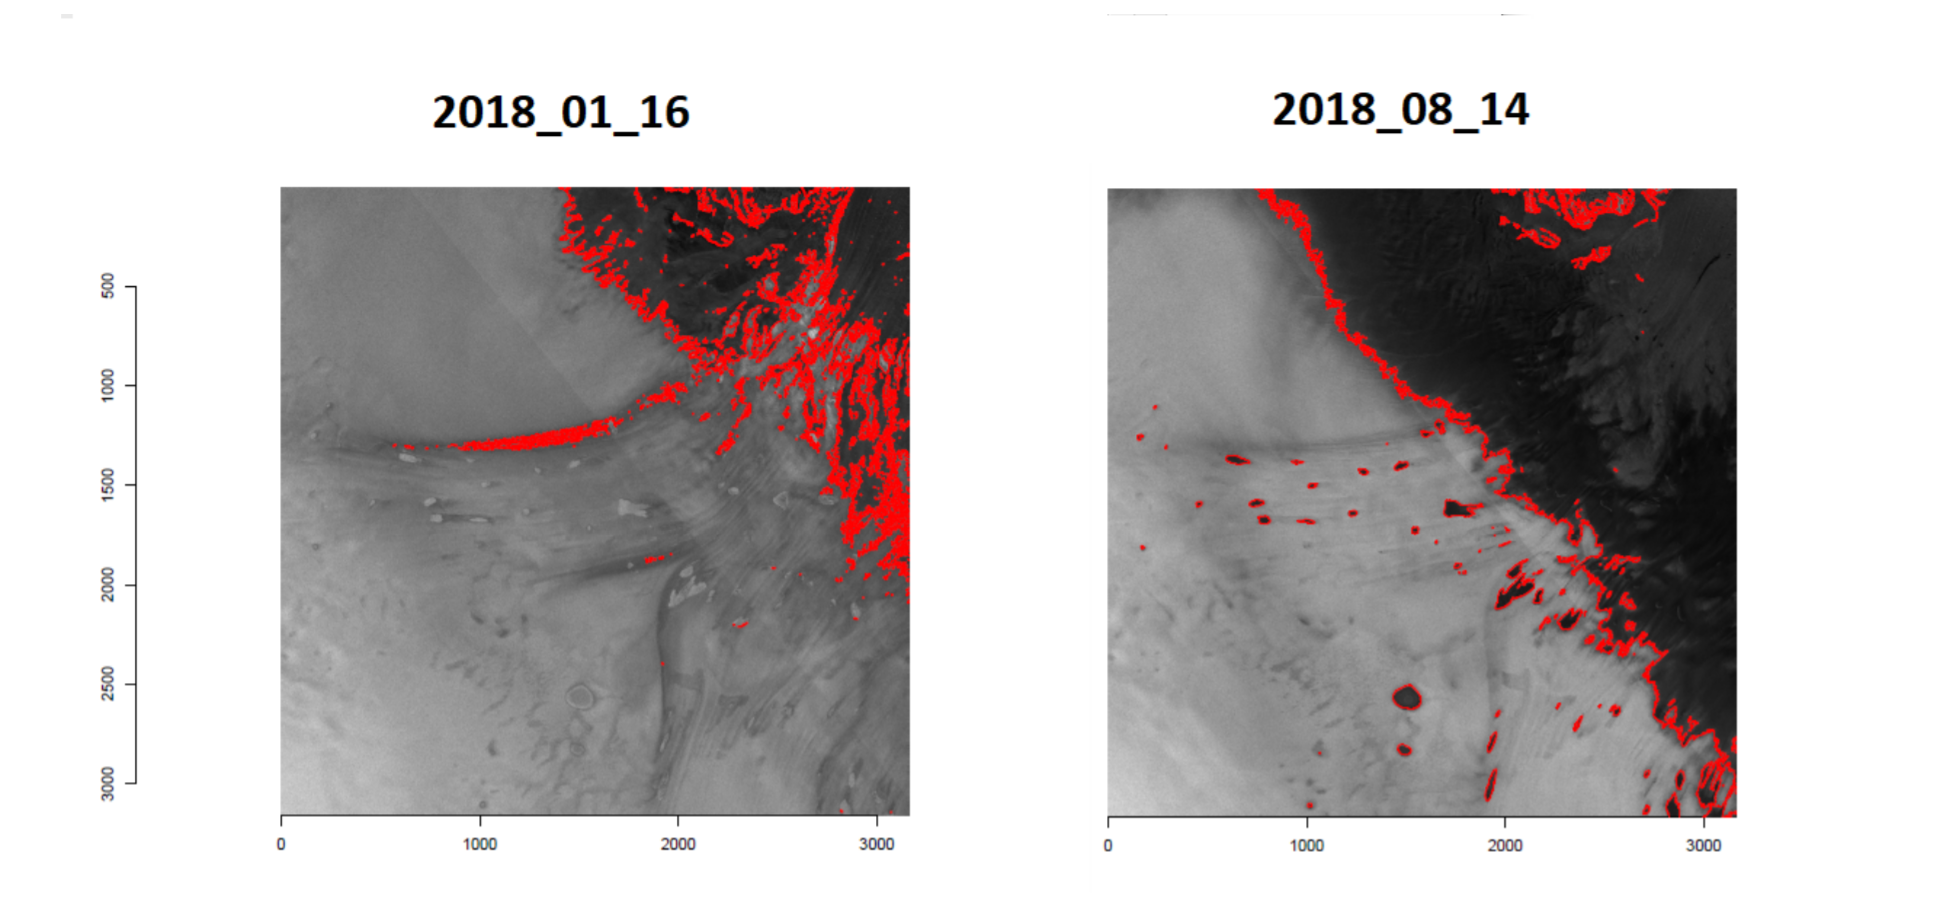
Figure 1: Binary classification and edge detection results. Left panel shows the melt vs non-melt edges detected in the winter; right panel shows the edges in the summer.
Multinomial classification. Multinomial logistic regressionis used to model nominal outcome variables, in which the log odds of the outcomes are modelled as a linear combination of the predictor variables. There are multiple categories on the Greenland ice sheet which might have different melting behaviours. With information from the LandSat optical image and assistance from glaciologist, we label SAR pixels as snow, black ice, blue ice, supraglacial lakes, and rock and use the labelled pixels and their SAR values as training data for categorizing all pixels in SAR images.
Time series analysis of SAR pixel values. For each ice sheet category, I sample a few pixels and extract time series at these pixels. I considered a state space model for capturing state changes in the SAR time series. Some possible states within the ice sheet categories are listed as follows:
• Blue ice: dry snow > melting snow > blue ice > dry snow;
• Always snow area: dry snow > melting snow > refreezing snow > dry snow;
• Melt ponds/ supraglacial lakes: dry snow > melting snow > open water > ice > dry snow;
• It is also possible for melt ponds to go: dry snow > melting snow > ice > open water > ice > dry snow.
As each location has an unknown number of states, I fit models with a set number of states and use some statistical criteria, such as BIC, to select the best fit, and the best fit model informs on the optimal number of states. I then analysed these time series, exploring melting behaviours within different categories and tried to establish a link between the categories and the number of states.
References
ALLEY, R. B. et al. Ice-sheet and sea-level changes. science, American Association for the Advancement of Science, v. 310, n. 5747, p. 456–460, 2005.
CANNY, J. A computational approach to edge detection. Elsevier, p. 184–203, 1987.
FETTWEIS, X. et al. Melting trends over the Greenland ice sheet (1958-2009) from spaceborne microwave data and regional climate models. 2011.
GREGORY, J. M.; HUYBRECHTS, P.; RAPER, S. C. Climatology: Threatened loss of the Greenland ice-sheet. Nature, Nature Publishing Group, v. 428, n. 6983, p. 616, 2004.
Related Blogs
-

Annual meeting of the Society for Decision Making under Deep Uncertainty, 2022
-

The Cryosphere 2022 Conference
-

DSNE Reseachers receive best poster award at CDE Conference 2022
Disclaimer
The opinions expressed by our bloggers and those providing comments are personal, and may not necessarily reflect the opinions of Lancaster University. Responsibility for the accuracy of any of the information contained within blog posts belongs to the blogger.
Back to blog listing