Data Analysis
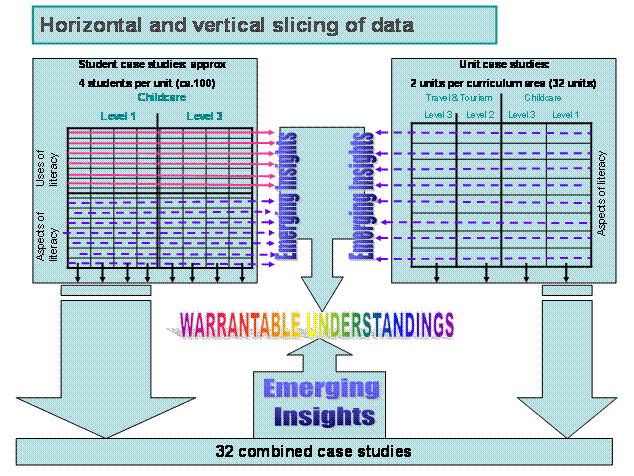
Phase One Data AnalysisPhase One was focused on 'induction' - that is, laying the ground for the main research rather than aiming to reach any firm conclusions. The analysis of this data was reflective, leading to many observations and generating questions and issues to be explored in more depth in Phase Two. From the interview data and the questionnaire we elicited a descriptive list of examples of all 'literacy demands' that were mentioned from interviews, observations and from the questionnaire. Using Nvivo and Atlas-ti software packages, we categorised this data using an analytical framework based on the categories of our questionnaire. We treated the processes of coding as a means of questioning the categories and the relationships among them. Inter-rater reliability sessions showed us the variability in how we interpreted and applied the analytical framework, and led to firming up the operational definitions of the categories. Simultaneously we identified emergent themes in the data which were not captured through the application of the coding matrix. These open-ended themes were regularly shared, discussed and reflected upon across the research team. The low response rate to the questionnaire limited the kinds of statistical analysis that were possible with this data, but some single variant analysis was possible with the number of questionnaires and this provided quantitative information on literacy demands and practices that could be triangulated against the qualitative data from the interviews. Phase Two Data AnalysisAnalysis proceeded in two complementary ways through vertical and horizontal slicing of the data set, to strengthen the warrant of the understandings reached. The interaction between the different forms of analysis is represented diagrammatically below. Above: The interaction of different forms of analysis
Case studies were written up using theoretically derived headings for each of the units studied. This enabled detailed analysis of each discrete unit, and comparisons to be explored across the different units. Case studies were also written for each student. Again, these were structured according to theoretically derived headings and emerging themes. Comparisons were enabled through the setting up of a multi-dimensional database and Atlas-ti was used for more detailed analysis of themes. Further details of data analysis
Phase Three Data AnalysisIn Phase Three (September 2005 to August 2006) the college based and university based researchers collaborated to design curriculum developments in the selected areas, based on the findings from Phase Two. The analysis involved synthesising data from multiple sources into 'Innovation case studies'. These were then systematically compared and contrasted to deduce a) a typology of changes in practice; b) the underlying aspects of literacy practices which can be fine-tuned |
| People & Links | Publications | Workshop Materials | Contact |
